
User Manual

INSTRUCTIONS
www.Hydrofarm.com
4
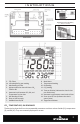
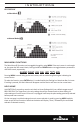
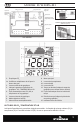
TREND CHART
The trend chart (1) displays the past readings for any of the three parameters (CO
2
/Temp/RH). There
are 4 modes that can be toggled by using UP key: CO
2
, TEMP, RH, and Cycle (automacally cycles
through CO
2
/Temp/RH), as shown below.
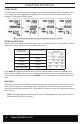
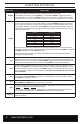
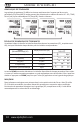
TREND CHART ZOOM
Below is a table that shows the available Zoom Levels for all parameters (CO
2
, Temp and RH) as well as
the duraon of each division for corresponding Zoom Levels:
Using DOWN will toggle the available Zoom Levels for each parameter. Note that in addion to the
Zoom Levels for each parameter, there is an opon that will automacally cycle between the Zoom
Levels. This can be achieved just by pressing DOWN unl icon (14) appears at the boom le of the
chart.
MAX/MIN
At the top right corner of the display, there are two numerical indicators: Max (2) and Min (5). As the
Zoom Level is changed, the Max and Min values will reect the maximum and minimum values on
the chart of the selected parameter (CO
2
, Temp and RH). At startup, the unit will automacally display
values for CO
2
.
NOTE: Trend chart contains a maximum of 17 sets of recorded data at one me. Aer the chart is
full the data is FIFO (rst-in, rst-out).
Zoom Level
(Time Span) (15)
Time Per Division (13)
1m (minute) 5sec /div
1h (hour) 5m/div
1d (day) 2h/div
1w (week) 0.5d/div
Auto Cycle Zoom Cycle