
Installation Instructions
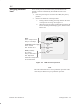
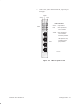
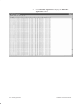
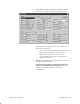
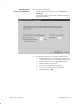
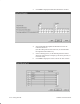
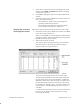
Table Of Contents
- Title page
- Contents
- About this manual
- Safety information
- Ch 1 - Introduction
- Ch 2 - Adding cards to the Controller
- Unpacking the System Controller
- Unpacking the picocells
- System Controller card configuration
- Adding cards to the System Controller (first steps)
- Jumper and DIP switch settings
- Attaching bus cables
- Adding cards to the System Controller (final steps)
- Configuring Controller cards
- Verifying the card configuration
- Ch 3 - Installing the Controller
- Ch 4 - Verifying the Controller configuration
- Ch 5 - Configuring the router
- Ch 6 - Testing picocells
- Ch 7 - Installing picocells
- Ch 8 - Connecting to external equipment
- Ch 9 - System testing
- Ch 10 - Installation inspection
- Ch 11 - Provisioning
- Ch 12 - Remote Client
- Ch 13 - Troubleshooting
- Ch 14 - Maintaining Quad T1 cards
- App A - Specifications
- App B - Standards compliance information
- App C - Part numbers
- App D - Updates and backups
- Index

1026209–0001 Revision B
Testing picocells 6–13
7. Check the box associated with the scanning picocell name
and select the Uplink / Downlink Scan in the Scan Mode
column when necessary.
8. Click Next to display the Start Scan Frequency Band Scan
window.
9. In the Start Scan Frequency Band Scan window (not shown
here), check these items only:
- View Band Scan results before generating Private
Operating and Traffic Frequencies
- View DCCH Scan results before generating Public
Service Profile information for AROS cell
Follow these steps to start the band scan and observe the results:
1. In the Start Scan Frequency Band Scan window, click Next
to start the frequency band scan.
When you click Next, the software displays a Measurement
in Progress window, and then (automatically) the Frequency
Band Scanning in Progress window.
2. Wait for the band scan to finish.
No results are shown until the frequency scan is finished.
The values shown in the Frequency Band Scanning in
Progress window are explained below:
The system continuously measures the received signal
strength indication (RSSI) for the whole band, and reports
the percentages above the given threshold as a cumulative
distribution. Each value is the percentage of samples above
the given RSSI, which is shown at the top of each column.
For example, for channel 2 above, 14% of the samples were
measured above –101 dBm (RSSI), and 33% were above
–105 dbm.
A “Time Started” message and value are shown in the lower
left corner of the window when the band scan is being
successfully performed.
Starting the scan and
observing the results