
User guide


SOLAR300 - SOLAR300N
EN - 33
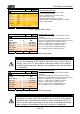
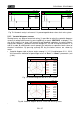
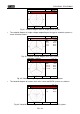
5.2.6. HARM analysis screens
Starting from any page of numerical values it’s possible to enter harmonics numerical
values and histogram graphics screens section for voltage and current input signals by
pressing F2 key (or touch HARM at display). By pressing cyclically F1 key the below
screens are shown by meter:
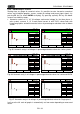
Harmonics values of V1, V2, V3 voltages and neutral voltage Vn (for three phase 4-
wire system), currents I1, I2, I3 and neutral current In with THD% values both with
histogram graphics and with numerical values in percentage or absolute value as below
shown:
12/09/2006 – 16:55:10
TOTAL HARM VOLTAGE – Page 1/5
h 01
Fs 100%
V
1h
100.0%
V
2h
100.0%
V
3h
100.0%
V
nh
0.0%
Thd
6.5%
Thd
5.9%
Thd
4.3%
Thd
0.0%
PAGE HARM I TABLE HARM PAG
12/09/2006 – 16:55:10
TOTAL HARM VOLTAGE – Page 1/5
h 01
Fs 400.0V
V
1h
228.6V
V
2h
225.1V
V
3h
230.7V
V
nh
0.0V
Thd
6.5%
Thd
5.9%
Thd
4.3%
Thd
0.0%
PAGE HARM I TABLE HARM PAG
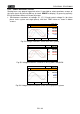
Fig. 65: Harmonic analysis of voltages in percentage/absolute values for 4-wire systems
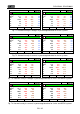
12/09/2006 – 16:55:10
TOTAL HARM VOLTAGE – Page 1/4
h 01
Fs 100%
V
12h
100.0%
V
23h
100.0%
V
31h
100.0%
Thd
6.5%
Thd
5.9%
Thd
6.5%
PAGE HARM I TABLE HARM PAG
12/09/2006 – 16:55:10
TOTAL HARM VOLTAGE – Page 1/4
h 01
Fs 400.0V
V
12h
328.4V
V
23h
389.6V
V
31h
386.6V
Thd
6.5%
Thd
5.9%
Thd
4.3%
PAGE HARM I TABLE HARM PAG
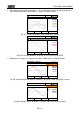
Fig. 66: Harmonic analysis of voltages in percentage/absolute values for 3-wire and ARON
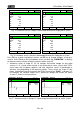
12/09/2006 – 16:55:10
PHASE1 HARM VOLTAGE – Pag 1/2
h 01
Fs 100%
V
1h
100.0%
Thd
6.5%
PAGE HARM I TABLE HARM PAG
12/09/2006 – 16:55:10
PHASE1 HARM VOLTAGE – Pag 1/2
h 01
Fs 400.0V
V
1h
228.6V
Thd
6.5%
PAGE HARM I TABLE HARM PAG
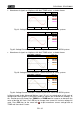
Fig. 67: Harmonic analysis of voltages in percentage/absolute values for Single phase
In all case the full scale of graphs is automatically set from meter depending on measured
values.