User manual SOLAR300 – SOLAR300N Copyright HT ITALIA 2013 Release EN 2.
SOLAR300 - SOLAR300N Table of contents: 1. PRECAUTIONS AND SAFETY MEASURES ............................................................. 4 1.1. 1.2. 1.3. 1.4. 1.5. 2. General ................................................................................................................................. 4 Preliminary instructions ......................................................................................................... 4 During use ...........................................................
SOLAR300 - SOLAR300N 5.3.3.3. 5.3.3.4. 5.3.4. Setting of minimum irradiance threshold ......................................................................................... 50 Setting of corrective constant of DC clamp...................................................................................... 50 Advanced Settings screen – NPV systems .............................................................................. 51 5.3.4.1. 5.3.4.2. 5.3.4.3. 5.3.4.4. 5.3.4.5. Zoom graphics option .........
SOLAR300 - SOLAR300N 7.1. Test of PV-1 system with remote unit SOLAR-01.................................................................. 147 7.2. Test of PV-1 system with remote unit SOLAR-02.................................................................. 149 7.3. Test of PV-3 system with remote unit SOLAR-01.................................................................. 151 7.4. Test of PV-3 system with remote unit SOLAR-02.................................................................. 153 7.5.
SOLAR300 - SOLAR300N 1. PRECAUTIONS AND SAFETY MEASURES 1.1. GENERAL This meter has been designed in compliance to IEC/EN61010-1 directive.
SOLAR300 - SOLAR300N 1.3.
SOLAR300 - SOLAR300N 2. GENERAL DESCRIPTION 2.1. Introduction – PV and NPV systems The instrument allows a totally new approach to the measuring world when dealing with photovoltaic systems and mains analyses on single-phase and three-phase electrical systems; the combination between instruments provided with microprocessor and the Windows CE technology allows analyzing a huge amount of data in such a simple and quick way as with no other system available.
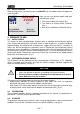
SOLAR300 - SOLAR300N 2.3. INITIAL SCREEN When turning on the instrument by pressing ON/OFF key, this below screen will appear for a few seconds: SOLAR 300N HT Sn:1303004 Calibration Date: Here you can see (besides model code and manufacturer name): The serial number of the meter (Sn) The release of internal meter Firmware (Rel.:) Date of last calibration (Calibration Date:) Rel:1.32 25/01/2010 3. PREPARE TO USE 3.1.
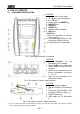
SOLAR300 - SOLAR300N 4. HOW TO OPERATE 4.1. INSTRUMENT DESCRIPTION CAPTION: 1. Voltage and Current inputs. 2. TFT display with “touchscreen”. 3. F1 – F4 keys. 4. Arrows keys and ENTER key. 5. GO/STOP key. 6. SAVE key. 7. ON/OFF key. 8. Input for external adapter. 9. HELP key. 10. ESC key. 11. Port for connection to external Flash memory. 12. Connection to SOLAR- 0x / Port for external USB Pen Driver. 13. USB output for PC connection. Fig. 1: Description of meter's front panel CAPTION: 1.
SOLAR300 - SOLAR300N 4.2. KEYBOARD DESCRIPTION The below keys are available: Key Keys Key Key ON/OFF: press this key to turn on the meter. Press and hold the key for few seconds to turn off the meter. F1, F2, F3, F4: multifunction keys. The various functions are intended from the s shown on the bottom of display. ESC: to leave a menu or a sub-menu. The smart icon which is shown on screens performs the same function under interactive mode.
SOLAR300 - SOLAR300N 4.3. DISPLAY DESCRIPTION The display is a graphic TFT colour type, 73x57mm sizes (VGA 320x240 pxls) with “touchscreen” which permits a really easy operations using standard PT400 pointer pen fitted in lateral side of meter. On first display’s row the system date/hour is shown by meter (see § 5.1.2 for settings). There are also some icons relative to battery level indication or external adapter fitted and for waiting and start of a recording.
SOLAR300 - SOLAR300N 5. GENERAL MENU Whenever you turn on the meter, the below “Analyzer Configuration” screen is shown, relative to the last configuration used (see Fig. 6): Fig. 6: Example of analyzer configuration In this situation the user can decide whether modify the actual configuration by pressing F1 key (or “CHANGE” at display – see § 5.3.1) or directly access to General Menu by pressing F4 key (or the “OK” at display).
SOLAR300 - SOLAR300N 5.1. GENERAL SETTINGS Fig. 8: MENU GENERAL screen - General settings section This section permits to set the below control parameters: System language System Date/Hour Display brightness Protection password during recordings Key sound on pressure Auto Power OFF Enable/Disable Type of memory in which to save the recordings Perform “touch screen” display calibration (TOUCH) Pressing ENTER key (or touch the relative icon at display).
SOLAR300 - SOLAR300N 5.1.2. Date/Time settings 1. Press the F1 key (or touch DATE at display) on screen of Fig. 9. The below screen is shown by meter: Fig. 10: Date/Time settings screen 2. Move the cursor using arrows keys on field relative to “Date format” and “Time format”, marked with blue background. 3. Using F3 or F4 keys (or touch MOD(+) o MOD(-)) for Date setting choosing between the two possible formats (European EU or American US): Option EU Option US DD:MM:YY MM:DD:YY 4.
SOLAR300 - SOLAR300N 5.1.4. Protection Password setting The meter is provided with a protection password to avoid the risk of accidental recording interruption. 1. Move the cursor using arrows keys on field relative to “Password” , marked it with blue background: Fig. 12: Protection password settings screen 2. Use F3 or F4 keys (alternatively touch MOD(+) o MOD(-)) to enable “YES” or disable “NO” of Password. 3.
SOLAR300 - SOLAR300N 5.1.5. Sound keys setting The meter permits to enable a instantaneous sound for any key pressure of the frontal panel. 1. Move the cursor using arrows keys on field relative to “Sound”, marked with blue background: Fig. 14: Keys sound settings screen 2. Use F3 or F4 keys (alternatively touch MOD(+) o MOD(-)) to enable “YES” or disable “NO” of keys sound. 3. Pressing SAVE or ENTER keys (or the smart icon ) to save the selected option and confirm by “Ok”.
SOLAR300 - SOLAR300N 5.1.7. Memory type setting The meter permits saving of recordings both in its internal memory (about 15Mbytes) and by using an external compact flash (see § 5.7.5 for details) fitted (see Fig. 3). Regardless of the capacity of the memory inserted, the maximum size of a recording is set to 32Mbytes. A Compact Flash memory of higher capacity will therefore be able to contain a high number of recordings, each one of which will have a maximum size of 32Mbytes.
SOLAR300 - SOLAR300N 5.2. REAL TIME VALUES Fig. 18: GENERAL MENU screen - Real time values section In this section the real time measured values of parameters both on input channels and internally calculated are shown by meter. In particular the following are shown: 1. Values of the electrical and environmental quantities (irradiation, temperature) of a photovoltaic system for generating single-phase or three-phase electric power. 2. Values regarding the maximum efficiency point. 3.
SOLAR300 - SOLAR300N 5.2.2. Single-MPPT photovoltaic system screen – Three-phase output The instrument displays the following parameters: DC PV PARAMETERS CAPTION: PRp: Performance Ratio (ref.
SOLAR300 - SOLAR300N 5.2.3.1. Multi-MPPT photovoltaic system screen – Single-phase output When SOLAR300N is in connection with MPP300, the display shows the following parameters: PARAMETER CAPTION: PRp: Performance Ratio (ref.
SOLAR300 - SOLAR300N 5.2.3.2. Multi-MPPT photovoltaic system screen – Three-phase output When SOLAR300N is in connection with MPP300, the display shows the following parameters: PARAMETER CAPTION: PRp: Performance Ratio (ref.
SOLAR300 - SOLAR300N 5.2.4.1. 4-wire three phase system – Screens sequence 12/09/2006 – 16:55:10 TOTAL RMS VALUES – Page x/y V1N V2N V3N VNPE 0.0 0.0 0.0 0.0 V V12 0.0 V23 0.0 V31 0.0 NEG% ZERO% 0.0 0.0 I1 I2 0.0 0.0 PAGE SCOPE V SEQ Hz 000 0.0 I3 IN 0.0 0.
SOLAR300 - SOLAR300N 12/09/2006 – 16:55:10 PHASE 2 RMS VALUES – Page x/y V2N I2 Patt2 Preatt2 Papp2 Pf2 CosPhi2 = = = = = = = PAGE PARAMETERS CAPTION: V2N Phase-Neutral voltage L2 phase I2 Current on L2 phase Pact2 Active Power L2 phase Preact2 Reactive Power L2 phase Papp2 Apparent Power L2 phase Pf2 Power factor L2 phase CosPhi2 Power factor between fundamental of voltage L2 and current L2 0.0 V 0.0 A 0 W 0 Var 0 VA 0.00i 0.00i SCOPE HARM VECTORS Fig.
SOLAR300 - SOLAR300N CAUTION The Total Consumed Energy page is shown only if the instrument has been set for the Recording of the General Parameter Total “Active Power & Energy” (see § 5.4.2.7). Values will be shown only during or at the end of a recording and zeroed upon starting a new recording or when the instrument is switched off 25/01/2013 – 16:55:10 TOT. ENERGY PRODUCTION – Page x/y Eact = Ppeak = Date Ppeak : Start rec. : Stop rec. : Rec Time : Int. Per.
SOLAR300 - SOLAR300N 5.2.4.2. 3-wire three phase system – Screens sequence 12/09/2006 – 16:55:10 TOTAL RMS VALUES – Page x/y V1PE V2PE V3PE 0.0 0.0 0.0 V V12 0.0 V23 0.0 V31 0.0 V NEG% ZERO% SEQ Hz 0.0 0.0 000 0.0 I1 I2 I3 0.0 0.0 0.
SOLAR300 - SOLAR300N 12/09/2006 – 16:55:10 PHASE 2 RMS VALUES – Page 4/6 V2PE I2 Patt2 Preatt2 Papp2 Pf2 CosPhi2 = = = = = = = PAGE PARAMETERS CAPTION: V2PE Phase L2-PE voltage I2 Current on L2 phase Pact2 Active Power L2 phase Preact2 Reactive Power L2 phase Papp2 Apparent Power L2 phase Pf2 Power factor L2 phase CosPhi2 Power factor between fundamental of voltage L2 and current L2 0.0 V 0.0 A 0 W 0 Var 0 VA 0.00i 0.00i SCOPE HARM VECTORS Fig.
SOLAR300 - SOLAR300N CAUTION The Total Consumed Energy page is shown only if the instrument has been set for the Recording of the General Parameter Total “Active Power & Energy” (see § 5.4.2.7). Values will be shown only during or at the end of a recording and zeroed upon starting a new recording or when the instrument is switched off PARAMETERS CAPTION: Eact Total active energy produced when starting recording. Ppeak Maximum peak of produced active power.
SOLAR300 - SOLAR300N 12/09/2006 – 16:55:10 WATTMETER12 – Page x/y V12 I1 Patt12 Preatt12 Papp12 Pf12 CosPhi12 = = = = = = = PAGE PARAMETERS CAPTION: V12 Phase L1 – Phase L2 voltage I1 Current on L1 phase Pact12 Active Power Wattmeter 12 Preact12 Reactive Power VARmeter 12 Papp12 Apparent Power VAmeter 12 Pf12 Power Factor Wattmeter 12 CosPhi12 Power Factor between fundamental of voltage and current Wattmeter 12 0.0 V 0.0 A 0 W 0 Var 0 VA 0.00i 0.00i SCOPE HARM VECTORS Fig.
SOLAR300 - SOLAR300N CAUTION The Total Consumed Energy page is shown only if the instrument has been set for the Recording of the General Parameter Total “Active Power & Energy” (see § 5.4.2.7). Values will be shown only during or at the end of a recording and zeroed upon starting a new recording or when the instrument is switched off 25/01/2013 – 16:55:10 TOT. ENERGY PRODUCTION – Page x/y Eact = Ppeak = Date Ppeak : Start rec. : Stop rec. : Rec Time : Int. Per.
SOLAR300 - SOLAR300N 12/09/2006 – 16:55:10 FLICKER – Page 2/2 V1N Pst1’ 0.0 Pst 0.0 Pst max 0.0 Plt 0.0 Plt max 0.0 Recording Time: PAGE SCOPE PARAMETERS CAPTION: Pst1’ Short term severity after 1minute Pst Short term severity Pstmax Maximum short term severity Plt Long term severity Pltmax Maximum long term severity Recording Time Real time duration of recording expressed in HH:MM 00h – 00min HARM VECTORS Fig. 51: Page of Flicker values 25/01/2013 – 16:55:10 TOT.
SOLAR300 - SOLAR300N 5.2.5. SCOPE waveforms screens Starting from a any page of numerical values it’s possible to select waveforms screens of the input signals by pressing F2 key (or touch SCOPE at display).
SOLAR300 - SOLAR300N Simultaneous waveforms of currents I1, I2, I3 and neutral current In (for three phase 4wire system) with their TRMS values as shown in below screens: 12/09/2006 – 16:55:10 SCOPE CURRENTS – Page 2/5 Fs I1 I2 I3 In 400.0A 299.4A 302.5A 297.7A 97.8 A PAGE Fig. 57: Current waveforms screen for 4-wire systems 12/09/2006 – 16:55:10 SCOPE CURRENTS – Page 2/5 Fs I1 I2 I3 400.0A 299.4A 302.5A 297.7A PAGE Fig.
SOLAR300 - SOLAR300N Waveforms of signals on L2 phase, with their TRMS values, as below shown: 12/09/2006 – 16:55:10 SCOPE PHASE2 – Page 4/5 Fs V2 Fs I2 PAGE 400.0V 228.5V 400.0A 302.5A ZOOM V Fig. 61: Voltage/Current waveforms screen L2 phase for 4-wire systems 12/09/2006 – 16:55:10 SCOPE PHASE2 – Page 4/5 Fs V23 Fs I2 PAGE 400.0V 389.6V 400.0A 203.5A ZOOM V Fig.
SOLAR300 - SOLAR300N 5.2.6. HARM analysis screens Starting from any page of numerical values it’s possible to enter harmonics numerical values and histogram graphics screens section for voltage and current input signals by pressing F2 key (or touch HARM at display).
SOLAR300 - SOLAR300N Change to currents screens by pressing F2 key (or touch “HARM I” at display). By pressing F1 key (or the PAGE at display) the screens of total values and each phase currents I1, I2, I3 and In. The main screens are below shown: 12/09/2006 – 16:55:10 TOTAL HARM CURRENT – Pag 1/5 12/09/2006 – 16:55:10 TOTAL HARM CURRENT – Pag 1/5 h 03 Fs I1h I2h I3h Inh Thd Thd Thd Thd PAGE HARM V TABLE h 03 100% 45.3% 48.7% 37.6% 0.0% 35.5% 32.8% 42.5% 0.
SOLAR300 - SOLAR300N 12/09/2006 – 16:55:10 VOLTAGE HARMONICS h[%] Thd% DC Phase 1 Phase 2 Phase 3 6.5 12/09/2006 – 16:55:10 VOLTAGE HARMONICS Neutral h[V] 4.3 0.0 0.0 0.0 Thd% DC Phase 1 Phase 2 Phase 3 6.5 Neutral 0.0 5.9 0.0 0.0 5.9 0.0 h1 100.0 100.0 100.0 0.0 h1 228.6 225.1 230.7 0.0 h2 0.0 0.0 0.0 0.0 h2 0.0 0.0 0.0 0.0 h3 1.8 2.3 1.5 0.0 h3 4.2 5.3 3.4 0.0 0.0 0.0 0.0 h4 0.0 0.0 0.0 h4 0.0 HARM I GRAPHIC HARM PAG 0.0 HARM I GRAPHIC 4.3 0.0 0.
SOLAR300 - SOLAR300N 12/09/2006 – 16:55:10 VOLTAGE HARMONICS h[%] Thd% DC 12/09/2006 – 16:55:10 VOLTAGE HARMONICS Phase 1 6.5 0.0 h[V] Phase 1 Thd% DC 6.5 0.0 h1 100.0 h1 228.6 h2 0.0 h2 0.0 h3 1.8 h3 4.2 h4 0.0 HARM I h4 GRAPHIC HARM PAG 0.0 HARM I GRAPHIC HARM PAG Fig. 75: Harmonic analysis voltage in percentage/absolute for Single phase system 12/09/2006 – 16:55:10 CURRENT HARMONICS 12/09/2006 – 16:55:10 CURRENT HARMONICS h[%] Phase 1 h[A] Phase 1 Thd% DC 35.
SOLAR300 - SOLAR300N 12/09/2006 – 16:55:10 PHASE1 HARM CURRENT – Pag 2/5 12/09/2006 – 16:55:10 PHASE1 HARM CURRENT – Pag 2/5 h 03 Fs I1h Thd PAGE HARM V TABLE h 03 100% 45.3% 35.5% HARM PAG Fs I1h Thd PAGE HARM V TABLE 200.0A 90.6A 35.5% HARM PAG Fig. 78: Harmonic analysis of current I1 in percentage/absolute values for 4-wire system 5.2.7.
SOLAR300 - SOLAR300N 12/09/2006 – 16:55:10 PHASE1 DIAGRAM – Page 1/1 V1^ I1 60.0° PAGE Fig. 81: Vectorial diagram total for Single phase system The vectorial diagram of single voltages depending on the type of selected systems as shown in below screens: 12/09/2006 – 16:55:10 VOLTAGES DIAGRAM – Page 2/6 NEG ZERO V1^ V2 V2^ V3 V3^ V1 0.0% 0.0% 120.0° 120.0° 120.0° PAGE Fig.
SOLAR300 - SOLAR300N The vectorial diagram of voltage and current for each phase depending on the type of system as shown in below screens: 12/09/2006 – 16:55:10 PHASE1 DIAGRAM – Page 4/6 V1^ I1 60.0° PAGE Fig. 85: Vectorial voltage-current diagram of L1 phase for 4-wire system 12/09/2006 – 16:55:10 PHASE2 DIAGRAM – Page 5/6 V2^ I2 60.0° PAGE Fig. 86: Vectorial diagram voltage-current of L2 phase for 4-wire system 12/09/2006 – 16:55:10 PHASE3 DIAGRAM – Page 6/6 V3^ I3 60.0° PAGE Fig.
SOLAR300 - SOLAR300N 12/09/2006 – 16:55:10 PHASE2 DIAGRAM – Page 5/6 V23^ I2 60.0° PAGE Fig. 89: Vectorial diagram voltage-current of L2 phase for 3-wire and ARON systems 12/09/2006 – 16:55:10 PHASE3 DIAGRAM – Page 6/6 V31^ I3 60.0° PAGE Fig. 90: Vectorial diagram voltage-current of L3 phase for 3-wire and ARON systems Pressing ESC key (or smart icon previous one.
SOLAR300 - SOLAR300N 5.3. ANALYZER SETTINGS Fig. 91: Analyzer settings screen In this section, the instrument allows carrying out basic and advanced selections according to the type of installation being tested.
SOLAR300 - SOLAR300N The screen displayed by the instrument for each of the six above-listed situations are reported below: Fig. 92: Screen for analyzer configuration for PV-1 system Fig. 93: Screen for analyzer configuration for PV-3 system Fig. 94: Analyzer configuration screen for MPP-1 system (opt. MPP300 required) Fig. 95: Analyzer configuration screen for MPP-3 system (opt.
SOLAR300 - SOLAR300N 12/09/2006 – 16:55:10 ANALYZER CONFIGURATION 1 2 3 N PE 4WIRE System 50 Freq [Hz] Clamp Type FLEX Clamp FS [A] 3000 1 VT Ratio ADVANCED MOD(+) MOD(-) Fig. 96: Analyzer configuration screen for 4-wire system 12/09/2006 – 16:55:10 ANALYZER CONFIGURATION 3WIRE System 50 Freq [Hz] Clamp Type FLEX Clamp FS [A] 3000 1 VT Ratio ADVANCED MOD(+) MOD(-) Fig.
SOLAR300 - SOLAR300N The connection of input signals to meter are shown in the small synoptic circuit scheme on the left part of each screen depending on the system. For system selection perform the below steps: 1. Move the cursor using arrows keys on field relative to “System”, marked with blue background. 2. Use F3 or F4 keys (alternatively touch MOD(+) o MOD(-)) to select the type of system choosing among “4-WIRE”, “3-WIRE”, “ARON” or “SINGLE” options. 3.
SOLAR300 - SOLAR300N 5.3.1.3. Setting full scale of clamps CAUTION The value of this parameter must be always equal to the full scale of the current clamps used to take the measurement. In case multi-scale clamps are used, the value of this parameter must be equal to the scale selected on the clamps If the type of system set is PV-1 or PV-3, MPP-1, MPP-3 it will be necessary to set the full scale both for the DC clamps and for the AC clamps 1.
SOLAR300 - SOLAR300N 5.3.2. Parameter setting screen – PV systems Press the F1 key or touch the “PARAM” item on the display. The instrument displays the following screen: Fig.
SOLAR300 - SOLAR300N 5.3.2.3. Setting the NOCT parameter of photovoltaic panels This option allows setting the value of the NOCT coefficient (nominal working temperature of a PV cell), one of the characteristic parameters of the panels used for the realization of a PV system, expressed in °C 1. Move the cursor on “NOCT” by means of the up or down arrow keys, so that it is highlighted in blue. 2.
SOLAR300 - SOLAR300N 5.3.2.6. Selection of the relationship for Temperature effects compensations This option allows selecting the relationship to be used to correct the measurements performed according to the modules’ temperature. The following correction modes are available: - T.mod.: - T.env: - ndc: Correction factor Rfv2 related to PV module Temp. (Italian guideline CEI-82-25) Correction factor Rfv2 related to environment Temp.
SOLAR300 - SOLAR300N 5.3.3. Advanced setting screen – PV systems Press the F2 key or touch the “ADVANCED” item on the display. The instrument displays the following screen: Selection of rem. U. SOLAR-01 Selection of rem. U. SOLAR-02 Selection of rem. U. MPP300 Fig. 101: Advanced setting screen for PV systems 5.3.3.1. Setting of remote unit This option allows to set the type of remote unit which can be used with the instrument. 1.
SOLAR300 - SOLAR300N 5.3.3.3. Setting of minimum irradiance threshold This option allow to set the minimum irradiance threshold used by meter as reference during measurement. 1. By means of the F3 or F4 key (or items MOD(+) or MOD(-) on the display), select the desired value within the range 400 800 W/m2 2. Press the SAVE or ENTER key (or the smart icon ) to save the selected setting by confirming with “Ok”. In this way, the settings made will remain valid also after turning off the instrument 3.
SOLAR300 - SOLAR300N 5.3.4. Advanced Settings screen – NPV systems By pressing F2 key (or touch the “ADVANCED” at display) in any screen of “Analyzer Configuration” section, below screen is shown by meter: 12/09/2006 – 16:55:10 ADVANCED SETTINGS Zoom graphics Harm. type Harm. values Zoom 1st harm Average values MANUAL ALL ABSOLUTE YES NO MOD(+) MOD(-) Fig. 103: Advanced Settings screen In the above screen is possible to select advanced options which have effect in Real Time values screens of meter. 5.3.
SOLAR300 - SOLAR300N 5.3.4.2. Harmonics type option This option permits to select the type of harmonics which can be shown inside Real Time values section 1. Move the cursor using arrows keys on field relative to “Harm. type” , marked it with blue background. 2.
SOLAR300 - SOLAR300N 5.3.4.4. Zoom with respect to the 1st harmonic option This option permits to show harmonics graphics with a zoom relative to the first harmonic order (fundamental) or with a zoom relative to the highest amplitude harmonic inside the Real Time values section. Also in this case the aim is to better the final resolution of graphics 1. Move the cursor using arrows keys on field relative to “Zoom 1st harm” , marked it with blue background. 2.
SOLAR300 - SOLAR300N 5.4. RECORDING SETTINGS 12/09/2006 – 16:55:10 GENERAL MENU Recording settings Fig. 104: Recording Settings screen selection In this section the meter permits to define any detail relative to start and stop of recordings, perform parameters selection for recording, the type of analysis to be carried out very and is particularly easily thanks to “touch screen” display. The use of smart icons recommended in this section. 5.4.1.
SOLAR300 - SOLAR300N Function CMP/EXP: used to compress / expand the sub-levels (the left and right arrow keys have the same function) Function PRESET: used to open the preset configuration section (see § 5.4.2.14) Function SEL: used to select/deselect parameters in different levels. Function MODIFY: used to make any modification inside the levels.
SOLAR300 - SOLAR300N 5.4.1.3. Items Start and Stop This item determines the activation and deactivation mode of the recordings which can be made with the instrument (see § 5.6). For PV systems, the start mode is set to “Manual” (Manu) and cannot be changed: Recording will therefore started/stopped only manually by pressing the GO/STOP key. 5.4.1.4. Item Integration period This item allows setting the integration period (see § 10.11.
SOLAR300 - SOLAR300N Fig. 108: Section General Parameters: selected parameters As a consequence of the operation, in the example shown in Fig. 85, 12 electric parameters have been selected against a total of 251 available and the instrument automatically provides the recording autonomy with the current settings.
SOLAR300 - SOLAR300N 5.4.1.6. Description of the sub-levels of item General Parameters Press the F1 key (CMP/EXP on the display) or the right or left arrow keys to expand or compress the sub-levels. The quantities shown in the sub-levels are closely related to the type of system considered and selected (see § 5.3.1). In the figures shown below, the different situations which may occur are shown: Fig.
SOLAR300 - SOLAR300N The following quantities can be selected for recordings in three-phase photovoltaic systems: Parameter Description Frequency Frequency of phases L1, L2, L3 TRMS voltages L1-L2, L2-L3, L3-L1 downstream the AC voltages inverter DC voltage DC voltage upstream the inverter Current TRMS currents L1, L2, L3 downstream the inverter DC currents DC current upstream the inverter Active power and active energy Total DC and AC active power and active energy Power factor Total power factor Table 3:
SOLAR300 - SOLAR300N 5.4.2.2) in which it is possible to define and save the custom name. Once this operation has ended, the instrument shows the following screen: 12/09/2006 – 16:55:10 PREDEFINED CONFIGURATIONS Typical Configuration DEFAULT ROSSI SYSTEM AGG CANC Fig. 112: Custom setting screen In the example above, the custom setting “ROSSI SYSTEM” has been created and can be loaded by pressing the SAVE or ENTER keys (or smart icon ).
SOLAR300 - SOLAR300N 5.4.1.9. Item General Parameters for use with MPP300 unit After setting MPP300 as remote unit (see § 5.3.3) the instrument will display a selection tree, in which it will be possible to change only the “comment” fields and the value of the integration period. Fig.
SOLAR300 - SOLAR300N 5.4.2. Recording settings screen – NPV systems This screen is designed with some levels and sub-levels as a typical tree Windows structure in order to reach with extreme details the desired options. After selection of “Recording settings” icon, the below screen is shown: RECORDING SETTINGS Comments: GENERIC PLANT Start:Manu Stop:Manu Integration Period:15 min Cogenerations + General Parameters 85/251 Parameters – Autonomy: 388d 4h CLP/EXP PREDEF. SEL MODIFY Fig.
SOLAR300 - SOLAR300N 5.4.2.2. Use of virtual keyboard With the Comments: marked in blue background at display press F4 key (or the MODIFY at display). The below screen is shown at display: Fig. 115: Virtual keyboard screen The keys’ description of the above keyboard is shown in the below table: Keys a, b,c,…z Cap 123 Sb àž <- Description Standard small letters keyboard for digit comments up to 25 characters Capital letters keyboard AZ is shown Numerical 09 besides mathematic operation symbols (+,-,*,/,.
SOLAR300 - SOLAR300N 5.4.2.4. Integration period This option permits to set the integration period (see § 10.11.1) which is the time interval between two sequential recordings within the global duration of measurements. The flag of this option is always active and not disabled. 1. Move the cursor using arrows keys on field relative to “Integration period” , marked it with blue background. 2. Press F4 key (alternatively touch the MODIFY at display).
SOLAR300 - SOLAR300N 5.4.2.6. General Parameters This option permits the selection of network parameters for recording operation. This level included several sub-level for a detailed selection depending on the type of system on test (see § 5.3.1). Depending on the selection performed, different error screen can be shown by meter. The below situations are possible: 12/09/2006 – 16:55:10 RECORDING SETTINGS + + General Parameters Harmonics Voltage Anom.
SOLAR300 - SOLAR300N 12/09/2006 – 16:55:10 RECORDING SETTINGS + General Parameters + Harmonics Voltage Anom.: 230V 6%-10% Inrush current: 30A 1s fix Flicker Unbalance Error: too many selected parameters 440/251 CLP/EXP PREDEF. SEL MODIFY Fig. 118: General Parameters section: too many selected parameters In the above screen the harmonics' selection brought about too many selected parameters (more than 251). Not select some parameters to quit this situation.
SOLAR300 - SOLAR300N 5.4.2.7. General Parameters: sub-levels description Press F1 key (or touch CLP/EXP at display) to expand or compress the sub-levels. The parameters inside sub-levels are strictly depending on type of selected system (see § 5.3.1).
SOLAR300 - SOLAR300N The below parameters can be selected for recording in Three phase 4-wire systems: Parameters Frequency Voltages Currents Active Power & Energy Reactive Power & Energy Apparent Power & Energy Power Factor CosPhi Description Frequency of phases L1, L2, L3 TRMS voltages L1-N, L2-N, L3-N, N-PE TRMS voltages L1-L2, L2-L3, L3-L1 TRMS currents L1, L2, L3, Neutral Active power and energy L1, L2, L3, Total Reactive (inductive or capacitive) power and energy L1, L2, L3, Total Apparent power and
SOLAR300 - SOLAR300N Press SAVE or ENTER keys (or the smart icon ) to save each selection and confirm by “Ok”. The main screen of Fig. 104 is shown by meter at the end of the operation. Press ESC key (or the smart icon ) to quit without saving and back to previous screens. 12/09/2006 – 16:55:10 RECORDING SETTINGS General Parameters Frequency - Voltages Phase1-Phase2 Phase2-Phase3 Phase3-Phase1 22/251 Parameters – Autonomy: 38d 16h - CLP/EXP PREDEF. SEL MODIFY Fig.
SOLAR300 - SOLAR300N 5.4.2.8. Harmonics: sub-levels description Press F1 key (alternatively touch CLP/EXP at display) to expand or compress the harmonics sub-levels. The parameters inside sub-levels are strictly depending on type of selected system (see § 5.3.1). Below there are some pictures of different possible situations: 12/09/2006 – 16:55:10 RECORDING SETTINGS Harmonics - Voltages THD DC + Odd + Even 162/251 Parameters – Autonomy: 19d 0h - CLP/EXP PREDEF. SEL MODIFY Fig.
SOLAR300 - SOLAR300N The selection parameters of harmonic analysis require the preliminary selection of voltages or currents inside General Parameter sub-level. The below error screen are shown in these cases: 12/09/2006 – 16:55:10 RECORDING SETTINGS Harmonics + Voltages + Currents Voltage Anom.: 230V 6%-10% Inrush current: 30A 1s fix Flicker Error: no selected current - CLP/EXP TYPICAL SEL MODIFY Fig.
SOLAR300 - SOLAR300N 5.4.2.9. Voltage Anomalies This option permits to set the control parameters relative to voltage anomalies (sags, swell, supply breaks – see § 10.4) recording which is completely independent from periodic analysis (regulated by integration period). The below screen is shown by meter: 12/09/2006 – 16:55:10 RECORDING SETTINGS + General Parameters + Harmonics Voltage Anom.
SOLAR300 - SOLAR300N 5.4.2.10. Inrush current This option permits to set the control parameters relative to recording of inrush current events (see § 10.6) which is completely independent from periodic analysis (regulated by integration period). The below screen is shown by meter: 12/09/2006 – 16:55:10 RECORDING SETTINGS + General Parameters + Harmonics Voltage Anom.: 230V 6%-10% Inrush current: 30A 1s fix Flicker Unbalance 132/251 Parameters – Autonomy: 15d 12h CLP/EXP PREDEF. SEL MODIFY Fig.
SOLAR300 - SOLAR300N 5.4.2.11. Flicker This option permits to set control parameters relative to flicker value recordings on the input voltages in compliance to EN 61000-4-15 and EN 50160 standards (see § 10.7). In particular the below parameters are shown by meter: Pst1’ = short term severity at 1 min; Pst = short term severity for all recording duration. Plt = long term severity for all recording duration.
SOLAR300 - SOLAR300N 5.4.2.12. Unbalance The selection of this option include on selected parameters list for recording the value of NEG% and ZERO% s which are index of unbalance of input voltage signal respective to negative tern and zero term (see § 10.8). “Unbalance” is not shown for single phase systems. 5.4.2.13. Spike This option permits to set the control parameters relative to recording of voltage fast transients (spike) events (see § 10.
SOLAR300 - SOLAR300N 5.4.2.14. Predefined configurations In order to make the recording start easier the meter includes 3 selectable predefined configurations which describe typical situation in electrical installations, besides a “Default” configuration which defines the initial settings from the factory. The meter also permits to define up to 16 free configuration which can be customized, saved and recalled by user at any time.
SOLAR300 - SOLAR300N 12/09/2006 – 16:55:10 PREDEFINED CONFIGURATIONS Typical Configuration DEFAULT VOLTAGE ANOMALIES HARMONICS POWER & ENERGY GENERIC PLANT ADD RAM Fig. 137: Typical customized configuration screen The typical customized configuration called e.g. “GENERIC PLANT” was defined and can be loaded by pressing the SAVE or ENTER keys (or the smart icon ). This configuration cab be removed in any time by pressing F2 key (or the REM at display).
SOLAR300 - SOLAR300N EN50160 MENU GENERAL Analyzer Settings Analyzer Settings - Advanced PARAMETER System Freq[Hz] Clamp Type FS Clamp[A] VT Ratio Zoom Graphics Harm. Type Harm. Values Zoom 1st Harm. Average Values Comments Start Stop Integration period Cogeneration General Parameters Recording Settings Voltage harmonics Current harmonics Voltage anomalies Ref.
SOLAR300 - SOLAR300N VOLTAGE ANOMALIES MENU GENERAL Analyzer Settings Analyzer Settings - Advanced PARAMETER System Freq[Hz] Clamp Type FS Clamp[A] VT Ratio Zoom Graphics Harm. Type Harm. Values Zoom 1st Harm. Average Values Comments Start Stop Integration period Cogeneration General Parameters Recording Settings Voltage harmonics Current harmonics Voltage anomalies Ref.
SOLAR300 - SOLAR300N HARMONICS MENU GENERAL Analyzer Settings Analyzer Settings - Advanced PARAMETER System Freq[Hz] Clamp Type FS Clamp[A] VT Ratio Zoom Graphics Harm. Type Harm. Values Zoom 1st Harm. Average Values Comments Start Stop Integration period Cogeneration General Parameters Recording Settings Voltage harmonics Current harmonics Voltage anomalies Ref.
SOLAR300 - SOLAR300N INRUSH MENU GENERAL Analyzer Settings Analyzer Settings Advanced PARAMETER System Freq[Hz] Clamp Type FS Clamp[A] VT Ratio Zoom Graphics Harm. Type Harm. Values Zoom 1st Harm. Average Values Comments Start Stop Integration period Cogeneration General Parameters Recording Settings Voltage harmonics Current harmonics Voltage anomalies Ref.
SOLAR300 - SOLAR300N POWER & ENERGY MENU GENERAL Analyzer Settings Analyzer Settings Advanced Recording Settings PARAMETER System Freq[Hz] Clamp Type FS Clamp[A] VT Ratio Zoom Graphics Harm. Type Harm. Values Zoom 1st Harm.
SOLAR300 - SOLAR300N DEFAULT CONFIGURATION (NPV systems) MENU GENERAL Analyzer Settings Analyzer Settings Advanced PARAMETER System Freq[Hz] Clamp Type FS Clamp[A] VT Ratio Zoom Graphics Harm. Type Harm. Values Zoom 1st Harm. Average Values Comments Start Stop Integration period Cogeneration General Parameters Recording Settings Voltage harmonics Current harmonics Voltage anomalies Ref.
SOLAR300 - SOLAR300N 5.5. Start a test on PV system For testing purposes, no setting of the recording parameters is necessary, but only of those relevant to the configuration of the analyzer (see § 5.3.2). The test can only be activated by pressing the F1 key (RUN) in GENERAL MENU Real time values screen. By accessing this screen, the values measured by the instrument will immediately be displayed in real time.
SOLAR300 - SOLAR300N The instrument can displays messages when pressing the F1 key: Message Before start a test, please check zero reading of DC clamp when it’s not connected to the plant Fw SOLAR-01 < 2.02 – Irr.min = 600W/m2 Fw SOLAR-01 < 2.03 – IP=2min No supply Wrong phase sequence Negative powers Solar 01 connected Solar 02 connected SOLAR-01 not connected SOLAR-02 not connected SOLAR-0x is not recording. Stop recording.
SOLAR300 - SOLAR300N 5.5.1. While testing After starting a test, the instrument allows displaying in real time both the parameters set and the current state of the operation. 1. Use the arrow keys or select the icon “Saved Data Management” in the GENERAL MENU. 2. With a recording in progress, press the ENTER key or touch the icon “Saved Data Management” on the display. The instrument displays the following screen: Fig. 141: Screen with information about recording in progress with PV system set 3.
SOLAR300 - SOLAR300N 5.5.2. Stop a test To stop a test (after connecting the unit SOLAR-0x or the unit MPP300 to the main unit), press the F1 key. The icon highlighted in Fig. 140 disappears from the display. After the automatic data transfer phase, the instrument will automatically display: The maximum performance outcome (max PRp), according to § 5.3.2.
SOLAR300 - SOLAR300N 5.6. START A RECORDING The meter is designed to start a recording in MANUAL or AUTOMATIC mode (the Automatic only for NPV systems - see § 5.4.2.3) by pressing of GO/STOP key. A recording operation can be started exclusively under the following screens: GENERAL MENU (with any selected icon) Real time values (in any internal screen) 12/09/2006 – 16:55:10 SCOPE VOLTAGES – Page 1/5 12/09/2006 – 16:55:10 GENERAL MENU Fs V1 V2 V3 Vn Meter information 400.0V 223.4V 228.5V 225.7V 0.
SOLAR300 - SOLAR300N CAUTION For recordings ALWAYS use the external power supply even though the instrument allows the operator to perform a recording using internal batteries. After starting a recording a preliminary real time evaluation about the situation on electrical installation it’s important in order to perform a correct settings, using the predefined configurations (see § 5.4.2.14) if necessary.
SOLAR300 - SOLAR300N Below the meaning of the above s of warning windows screen: Type of error Before start a test, please check zero reading of DC clamp when it’s not connected to the plant Fw SOLAR-01 < 2.02 – Irr.min = 600W/m2 Fw SOLAR-01 < 2.
SOLAR300 - SOLAR300N Press GO/STOP key again to start recording and verify the possible residual error on window message. Confirm with ENTER or press “Ok” or “Cancel” keys to close the warning window message and start the recording by pressing GO/STOP key anyway. As the default value of the integration periods is set at 15min (see § 10.11.1) the meter will store data in the temporary memory for this time.
SOLAR300 - SOLAR300N 5.6.2. During a recording After a recording is running, a real time check of parameters’s values and internal status is shown by meter. 12/09/2006 – 16:55:10 GENERAL MENU Recording results Fig. 149: Recording Results screen - Recording running 1. Select “Recording Results” in GENERAL MENU 2. Pressing ENTER or touch the correspondent icon at display.
SOLAR300 - SOLAR300N The instrument displays the following screen (with PV system set): Fig. 151: Screen with information about recording in progress with PV system set 4. The screen shown in Fig. 151 contains the following information: Recording autonomy of the instrument with selections made in Days/Hours Comments inserted in the relevant comment field of section “Analyzer setting” (see § 5.4.2.1).
SOLAR300 - SOLAR300N 5.7. SAVED DATA MANAGEMENT SECTION Fig. 152: GENERAL MENU - Saved Data Management The “Saved Data Management” section allows the user to check the content of the internal memory after recording, to delete previous recordings and possibly to copy a recording (one at a time) on an external USB Pen Driver connected to the instrument. By pressing the ENTER key or selecting the icon on the display, the instrument shows the following screen: Fig.
SOLAR300 - SOLAR300N The following operations are possible only on the screen in Fig. 153: 1. Use the up and down arrow keys to highlight (blue background) one of the recordings on the screen. Press the F1 key (or the INFO item on the display). The instrument shows the screen containing the main information regarding the recording performed as described in § 5.7.1. 2. Press the F3 key (or the DEL item on the display) to delete the last saved recording.
SOLAR300 - SOLAR300N 5.7.1.2. Recording graph By selecting the recording graph option, the following page is accessed, which enables the user to display the recording trend (ONLY ONE parameter at a time). Fig. 156: Selecting a parameter 1. Press the F1 key (or the PARAM item on the display) to access the page containing the recorded quantities available for the analysis (Fig. 157). Fig.
SOLAR300 - SOLAR300N This page shows the graph, the cursor position (cursor T) and the maximum, minimum and average RMS values of the parameter selected by the cursor. Fig. 158: Recording graph The following keys are active on this page: F1 key (or PARAM item on the display) to access the page of the selectable parameters (Fig. 157). F4 key (or OPTIONS item on the display) to access the page for the activation of the “Advanced graph” (Fig. 159).
SOLAR300 - SOLAR300N 5.7.1.3. Dips ans swells This page shows a table containing all voltage anomalies occurred during recording. Fig. 160: Dips ans swells Column description: N.: progressive number of the anomaly. L.: phase in which the anomaly occurred. Date/Time: date/time at which the anomaly occurred. Max/Min: maximum/minimum value of the anomaly. Duration: duration of the anomaly. Type: type of anomaly (voltage reduction or overvoltage).
SOLAR300 - SOLAR300N This page shows the parameters set before recording voltage anomalies: Fig. 161: Voltage Anomalies The following non-modifiable parameters are indicated (as they have been set upon starting the recording) Nominal Voltage: nominal voltage High Voltage: limit high voltage. Low Voltage: limit low voltage. VT: transformation ratio of the voltage transformers. This page also shows the total number of voltage anomalies occurred (Number of Anomalies).
SOLAR300 - SOLAR300N Description of the columns: N.: Progressive spike number. L.: Phase in which the spike occurred. Time: Date/time in which the anomaly occurred. Peak+: Max. positive value reached by the spike during the observation interval. Peak-: Min. negative value reached by the spike during the observation interval. Delta+: Max. relative positive differential reached by the spike during the observation interval. Delta-: Min.
SOLAR300 - SOLAR300N 5.7.1.5. Inrush currents This page shows a table containing all of the Inrush current occurred while recording Fig. 164: Inrush currents Description of the columns: N.: L.: Time: Max[A]: Progressive number of inrush current. Phase in which inrush current has occurred. Date/time in which the inrush current occurred. Maximum value reached by the inrush current.
SOLAR300 - SOLAR300N The following elements are indicated: Type: Set detection type: Fix: The instrument detects and saves an event when the current's RMS value calculated in each half-period exceeds the value of the threshold defined by the user. In order for the instrument to be ready to detect a new event, current must drop below the defined threshold value; Var: The instrument detects and saves an event each time the current's RMS value calculated in each half-period exceeds the previous RMS value (i.
SOLAR300 - SOLAR300N 5.7.1.6. EN50160 This page shows a table containing values complying with standard EN50160. Fig. 167: EN50160 analysis result Description of the columns: Param: It indicates the percentage of the values which must fall within the limits set in Limits. Example: Hz 100% means that 100% of the frequency values recorded must fall within a 1%, -1% range of the nominal frequency value.
SOLAR300 - SOLAR300N The following elements are indicated: Nominal Voltage: Set nominal voltage High Limit: Upper limit voltage Low Limit: Lower limit voltage Frequency: System frequency.
SOLAR300 - SOLAR300N 5.7.1.7. Analysis of consumed energy This page shows the Energy and Peak power values consumed while recording 25/01/2013 – 16:55:10 TOT. ENERGY CONSUMPTION – Pag x/y Eact = Ppeak = Date Ppeak : Start rec. : Stop rec. : Rec. Time : Int. Per. : PAGE SCOPE 15 Wh 1.31 kW 21/01/13 16:45:00 21/01/13 16:45:00 21/01/13 18:00:00 00d 1h 15m 15m HARM VECTORS Fig. 170: Screen of total consumed energy Description of the displayed values: Eact: Ppeak: Total active power consumed while Recording.
SOLAR300 - SOLAR300N 5.7.1.8. Analysis of producted energy This page shows the Energy and Peak power values producted while recording 25/01/2013 – 16:55:10 TOT. ENERGY PRODUCTION – Pag x/y Eact = 15 Wh Ppeak = 1.31 kW Date Ppeak : 21/01/13 16:45:00 Start rec. : 21/01/13 16:45:00 Stop rec. : 21/01/13 18:00:00 Rec. Time : 00d 1h 15m Int. Per. : 15m PAGE SCOPE HARM VECTORS Fig. 171: Screen of total producted energy Description of the displayed values: Eact: Ppeak: Total active power produced while Recording.
SOLAR300 - SOLAR300N 5.7.2. Recording analysis (RegPV type) This page shows the analyses which can be performed on the saved data (RegPV type). Fig. 172: Recording analysis (RegPV*-type data) 1. Use the arrow keys up or down to select the one of the available analisys on the screen. Pres F1 or ENTER key (or the item OPEN with the smart icon at display) to confirm the choice 2. The ESC key (or smart icon ) to exit the function and go back to the “Recording analysis” page (Fig. 153) 5.7.2.1.
SOLAR300 - SOLAR300N 5.7.2.2. Result for data of RecPV type This page (not available for RecPV* data as these recordings are, in fact, incomplete) displays the values of the parameters measured and calculated during the testing / recording phase. In particular, the instrument: Do not show any results if do not exist on the PV installation a “stable irradiance” condition more than the minimum irradiance threshold (see § 5.3.3.
SOLAR300 - SOLAR300N Legend of parameters for three-phase PV systems: Pdc AC DC Vdc Idc DC FV DC power at inverter input Photovoltaic panel performance DC voltage at inverter input DC current at inverter input AC power at inverter output Three-phase power factor at inverter output Three-phase inverter performance AC Vac1,2,3 AC voltage at inverter output Iac1,2,3 AC current at inverter output Pac Pf Irr Pnom Tpv Tenv Solar irradiation Nominal power of the photovoltaic sy
SOLAR300 - SOLAR300N 5.7.2.3. Result for data of RecMPP type This page shows the values of the parameters measured and calculated during the test / recording phase together with the MPP300 unit (optional). In particular, the instrument: Do not show any results if do not exist on the PV installation a “stable irradiance” condition more than the minimum irradiance threshold (see § 5.3.3.
SOLAR300 - SOLAR300N 5.7.2.4. Recording graph By selecting the recording graph option, the following page is accessed, which enables the user to display the recording trend (ONLY ONE parameter at a time). Fig. 177: Selecting a parameter 1. Press the F1 key (or the PARAM item on the display) to access the page of selectable parameters (Fig. 178). Fig.
SOLAR300 - SOLAR300N Fig. 179: Recording graph The following keys are active on this page: The F1 key (or the PARAM item on the display), to access the page of selectable parameters (Fig. 178) Press the F2 key to see the characteristic parameters of the photovoltaic system relevant to the point considered. Information is similar to that described in § 5.7.2.2 , but referred to the instant selected on the graph (i.e.
SOLAR300 - SOLAR300N 5.7.3. Recording analysis (Istant type) This page shows the analyses which can be performed on the saved data (Istant type). Fig. 181: Recording analysis (Istant-type data) 1. Use the up and down arrow keys to highlight on blue background one of the analyses on the screen. Press the F1 or ENTER key (or the OPEN item or the smart icon on the display) to confirm the type of analysis to be performed. 2.
SOLAR300 - SOLAR300N 5.7.3.2. Graph This screen (Fig. 183) contemporarily shows the saved instant values of the waveforms of voltages V1, V2, V3, Vn scaled according to the Full scale (Fs) and the relevant RMS values; these values have been saved by the instrument upon pressing the SAVE key. Fig.
SOLAR300 - SOLAR300N This screen (Fig. 185) contemporarily shows the waveforms of phase 1 voltage and current, scaled according to the Full scale (Fs), and the relevant RMS values; these values have been saved by the instrument upon pressing the SAVE key. Fig.
SOLAR300 - SOLAR300N This screen (Fig. 187) contemporarily shows the instant values of the waveforms of currents I1, I2, I3 scaled according to the Full scale (Fs) and the relevant RMS values; these values have been saved by the instrument upon pressing the SAVE key. Fig.
SOLAR300 - SOLAR300N This screen (Fig. 189) contemporarily shows the instant values of the waveforms of voltage V12 and current I1, scaled according to the relevant Full scale (Fs) and the relevant RMS values; these values have been saved by the instrument upon pressing the SAVE key. Fig.
SOLAR300 - SOLAR300N This screen (Fig. 191) contemporarily shows the instant values of the waveforms of voltage V23 and current I2, scaled according to the relevant Full scale (Fs) and the relevant RMS values; these values have been saved by the instrument upon pressing the SAVE key. Fig.
SOLAR300 - SOLAR300N This screen (Fig. 193) contemporarily shows the instant values of the waveforms of voltage V31 and current I3, scaled according to the relevant Full scale (Fs) and the relevant RMS values; these values have been saved by the instrument upon pressing the SAVE key. Fig.
SOLAR300 - SOLAR300N 5.7.3.3. Harmonics analysis This screen (Fig. 194) displays the harmonic values and the THD% value of voltages V1, V2, V3, Vn and of currents I1, I2, I3 and of Neutral current In in a graph (scaled according to the Full scale Fs) or in a table. The values displayed are percentage values of the fundamental or absolute values according to the configuration set in the ANALYZER CONFIGURATION MENU -> ADVANCED. Fig.
SOLAR300 - SOLAR300N This screen (Fig. 195) displays the harmonic values and the THD% value of voltages V12, V23, V31 and of currents I1, I2, I3 in a graph (scaled according to the Full scale Fs) or in a table. The values displayed are percentage values of the fundamental or absolute values according to the configuration set in the ANALYZER CONFIGURATION MENU -> ADVANCED. Fig.
SOLAR300 - SOLAR300N This screen (Fig. 196) displays the harmonic values and the THD% value of voltage V1 and current I1 in a graph (scaled according to the Full scale Fs) or in a table. The values displayed are percentage values of the fundamental or absolute values according to the configuration set in the ANALYZER CONFIGURATION MENU -> ADVANCED. Fig.
SOLAR300 - SOLAR300N This screen (Fig. 197) displays the harmonic values and the THD% value of voltage V1 and current I1 in a graph (scaled according to the Full scale Fs) or in a table. The values displayed are percentage values of the fundamental or absolute values according to the configuration set in the ANALYZER CONFIGURATION MENU -> ADVANCED. Fig.
SOLAR300 - SOLAR300N Fig. 198: Phase 1 harmonics in three-phase 3-wire system or Aron system The following keys are active on this page: The up (ZOOM+) or down (ZOOM-) arrow keys zoom in or out the histogram. The left and right arrow keys move the cursor left/right along the harmonics. The F1 key (or the PAG item on the display) advances to the following page of saved values, relative to phase 2 harmonics.
SOLAR300 - SOLAR300N This screen (Fig. 200) displays the harmonic values and the THD% value of voltage V23 and current I2 in a graph (scaled according to the Full scale Fs) or in a table. The values displayed are percentage values of the fundamental or absolute values according to the configuration set in the ANALYZER CONFIGURATION MENU -> ADVANCED. Fig.
SOLAR300 - SOLAR300N This screen (Fig. 202) displays the harmonic values and the THD% value of voltage V31 and current I3 in a graph (scaled according to the Full scale Fs) or in a table. The values displayed are percentage values of the fundamental or absolute values according to the configuration set in the ANALYZER CONFIGURATION MENU -> ADVANCED. Fig.
SOLAR300 - SOLAR300N This screen (Fig. 204) displays the harmonic values and the THD% value of neutral voltage Vn in a graph (scaled according to the Full scale Fs) or in a table. The values displayed are percentage values of the fundamental or absolute values according to the configuration set in the ANALYZER CONFIGURATION MENU -> ADVANCED. Fig.
SOLAR300 - SOLAR300N 5.7.3.4. Vectors This screen (Fig. 205) displays, with graphic and numeric indications, the phase delays expressed in degrees [°] between: Voltage V1 and V2, V2 and V3, V3 and V1. Voltage V1 and current I1. Voltage V2 and current I2. Voltage V3 and current I3. The latter allow finding out the inductive or capacitive nature of the electrical installation.
SOLAR300 - SOLAR300N The following keys are active on this page: The F1 key (or the PAG item on the display) advances to the following page of saved values relative to the voltage vector diagram. The ESC key (or the smart icon on the display) to exit the function and go back to the “Recording analysis” page (Fig. 181). This screen (Fig.
SOLAR300 - SOLAR300N This screen (Fig. 209) displays, with graphic and numeric indications, the phase delays, expressed in degrees [°], between voltage V12 and V23, V23 and V31, V31 and V12. Voltage unbalance values are also displayed. Fig. 209: Voltage vector diagram in three-phase 3-wire system or Aron system The following keys are active on this page: The F1 key (or the PAG item on the display) advances to the following page of saved values relative to the current vector diagram.
SOLAR300 - SOLAR300N This screen (Fig. 211) displays, with graphic and numeric indications, the phase delays, expressed in degrees [°], between voltage V1 and current I1, so that the inductive or capacitive nature of the electrical installation may be found out. In detail: positive angle: inductive load negative angle: capacitive load Fig.
SOLAR300 - SOLAR300N This screen (Fig. 213) displays, with graphic and numeric indications, the phase delays, expressed in degrees [°], between voltage V2 and current I2, so that the inductive or capacitive nature of the electrical installation may be found out. In detail: positive angle: inductive load negative angle: capacitive load Fig.
SOLAR300 - SOLAR300N This screen (Fig. 215) displays, with graphic and numeric indications, the phase delays, expressed in degrees [°], between voltage V3 and current I3, so that the inductive or capacitive nature of the electrical installation may be found out. In detail: positive angle: inductive load negative angle: capacitive load Fig.
SOLAR300 - SOLAR300N 5.7.3.5. Measures In measure mode, the instrument displays the saved values in TRMS as shown in the following figures: In this page, the following symbols are used: V1N Neutral - Phase L1 Voltage. V2N Neutral - Phase L2 Voltage. V3N Neutral - Phase L3 Voltage. VNPE Neutral - Ground Voltage. V12 Phase L1 - Phase L2 Voltage. V23 Phase L2 - Phase L3 Voltage. V31 Phase L3 - Phase L1 Voltage. Inv% % value of the Negative sequence unbalance. Omo% % value of the Zero sequence unbalance.
SOLAR300 - SOLAR300N The following keys are active on this page: The F1 key (or the PAG item on the display) advances to the following page of saved values. The ESC key (or the smart icon on the display) to exit the function and go back to the “Recording analysis” page (Fig. 181). In this page, the following symbols are used: V1N Phase L1 - Neutral Voltage. I1 Phase L1 current. Patt1 Phase L1 active power. Preatt1 Phase L1 reactive power. Papp1 Phase L1 apparent power. Pf1 Phase L1 power factor.
SOLAR300 - SOLAR300N The following keys are active on this page: The F1 key (or the PAG item on the display) advances to the following page of saved values. The ESC key (or the smart icon on the display) to exit the function and go back to the “Recording analysis” page (Fig. 181). In this page, the following symbols are used: V3N Phase L3 - Neutral Voltage. I3 Phase L3 current. Patt3 Phase L3 active power. Preatt3 Phase L3 reactive power. Papp3 Phase L3 apparent power. Pf3 Phase L3 power factor.
SOLAR300 - SOLAR300N The following keys are active on this page: The F1 key (or the PAG item on the display) advances to the following page of saved values. The ESC key (or the smart icon on the display) to exit the function and go back to the “Recording analysis” page (Fig. 181). In this page, the following symbols are used: Patt System total active power. Preatt Total reactive power. Papp Total apparent power. Pf Total power factor. CosPhi System total CosPhi.
SOLAR300 - SOLAR300N The following keys are active on this page: The F1 key (or the PAG item on the display) advances to the following page of saved values. The ESC key (or the smart icon on the display) to exit the function and go back to the “Recording analysis” page (Fig. 181). In this page, the following symbols are used: V2PE Phase L2 - PE Voltage. I2 Phase L2 current. Patt2 Phase L2 active power. Preatt2 Phase L2 reactive power. Papp2 Phase L2 apparent power. Pf2 Phase L2 power factor.
SOLAR300 - SOLAR300N The following keys are active on this page: The F1 key (or the PAG item on the display) advances to the following page of saved values. The ESC key (or the smart icon on the display) to exit the function and go back to the “Recording analysis” page (Fig. 181). In this page, the following symbols are used: V12 Phase L1 - Phase L2 Voltage. V23 Phase L2 - Phase L3 Voltage. V31 Phase L3 - Phase L1 Voltage. Inv% % value of the Negative sequence unbalance.
SOLAR300 - SOLAR300N The following keys are active on this page: The F1 key (or the PAG item on the display) advances to the following page of saved values. The ESC key (or the smart icon on the display) to exit the function and go back to the “Recording analysis” page (Fig. 181). In this page, the following symbols are used: V12 Phase L1 - Phase L2 Voltage I1 Phase L1 current. Patt12 Wattmeter 12 Active Power. Preatt12 Varmeter 12 reactive power. Papp12 Varmeter 12 apparent power.
SOLAR300 - SOLAR300N The following keys are active on this page: The F1 key (or the PAG item on the display) advances to the following page of saved values. The ESC key (or the smart icon on the display) to exit the function and go back to the “Recording analysis” page (Fig. 181). In this page, the following symbols are used: V1N Phase L1 - Neutral Voltage. VNPE Neutral - PE Voltage. Freq Frequency. I1 Phase L1 current. Patt1 Phase L1 active power. Preatt1 Phase L1 reactive power.
SOLAR300 - SOLAR300N 5.7.4. Transfer recordings to a external Pen Driver USB The meter permits to transfer of one or more saved recordings which are shown in Fig. 153 to a external Pen Driver USB directly connected to it (see Fig. 3). The below picture is shown by meter: 12/09/2006 – 16:55:10 RECORDING RESULTS N.
SOLAR300 - SOLAR300N 5.7.5. Saving recordings to external Compact Flash The instrument permits to save the recordings also on external standard compact flash which are fitted on suitable input (see Fig. 3) after activating “EXTERNAL” option on Memory type (see § 5.1.7).
SOLAR300 - SOLAR300N 5.8. METER INFORMATION Inside this section the general internal parameters of meter are available as information from the user for example during any contact with Service people of HT ITALIA. 12/09/2006 – 16:55:10 GENERAL MENU Meter Information Fig. 237: Menu General screen – Meter information section Press ENTER key or touch the correspondent icon at display.
SOLAR300 - SOLAR300N 6. CONNECTION OF METER TO PC (WIN XP) 1. Install the TopView standard software on your PC. 2. Verify the presence of ActiveSync icon with grey background (not active) on the right bottom part of PC screen as shown in below picture: Fig. 239: ActiveSync icon not active 3. Connect the meter to PC using the standard C2007 cable (USB “A” USB “B”) as shown in below screen: Fig. 240: Connection of meter to PC 4.
SOLAR300 - SOLAR300N 7.
SOLAR300 - SOLAR300N 7.1. TEST OF PV-1 SYSTEM WITH REMOTE UNIT SOLAR-01 CAUTION The maximum voltage between inputs D1, D2, A1, A2 and A3 is 1000V / CAT IV 600V to earth. Do not measure voltages exceeding the limits indicated in this manual.
SOLAR300 - SOLAR300N 6. Check that the active power Pac is positive and that the power factor Pf corresponds to the load (typically equal to 1.00 for measures made downstream the inverter in photovoltaic systems). In case of negative values of the active power open the clamp, rotate it by 180° and connect it again to the conductor 7. Turn on the SOLAR-01 unit by means of the relevant key on the unit itself. SOLAR-01 will switch to stand-by mode (STATUS LED flashing) 8.
SOLAR300 - SOLAR300N 7.2. TEST OF PV-1 SYSTEM WITH REMOTE UNIT SOLAR-02 CAUTION The maximum voltage between inputs D1, D2, A1, A2 and A3 is 1000V / CAT IV 600V to earth. Do not measure voltages exceeding the limits indicated in this manual.
SOLAR300 - SOLAR300N 5. Connect the AC current clamp to the Phase L1 conductor by respecting the direction of the arrow on the clamp itself as indicated in Fig. 243. Connect the output of the clamp to the I1 input of the instrument. 6. Supply the electric system considered in case it was temporarily put out of service for connecting the instrument 7. Check that the active power Pac is positive and that the power factor Pf corresponds to the load (typically equal to 1.
SOLAR300 - SOLAR300N 7.3. TEST OF PV-3 SYSTEM WITH REMOTE UNIT SOLAR-01 CAUTION The maximum voltage between inputs D1, D2, A1, A2 and A3 is 1000V / CAT IV 600V to earth. Do not measure voltages exceeding the limits indicated in this manual.
SOLAR300 - SOLAR300N 6. Check that the active power Pac is positive and that the power factor Pf corresponds to the load (typically equal to 1.00 for measures made downstream the inverter in photovoltaic systems). In case of negative values of the active power, check the connection of the amperometric clamps.
SOLAR300 - SOLAR300N 7.4. TEST OF PV-3 SYSTEM WITH REMOTE UNIT SOLAR-02 CAUTION The maximum voltage between inputs D1, D2, A1, A2 and A3 is 1000V / CAT IV 600V to earth. Do not measure voltages exceeding the limits indicated in this manual.
SOLAR300 - SOLAR300N 7. Check that the active power Pac is positive and that the power factor Pf corresponds to the load (typically equal to 1.00 for measures made downstream the inverter in photovoltaic systems). In case of negative values of the active power, check the connection of the amperometric clamps.
SOLAR300 - SOLAR300N 7.5. TEST OF PV SYST. WITH SINGLE/MULTI MPPT – SINGLE/THREE PHASE AC The instrument SOLAR300N, used together with remote units SOLAR-02 and MPP300 (optional), allows testing PV systems characterized by 1 or more PV fields (with the same direction and inclination), each connected to an MPPT of the inverter (see § 10.3) and singlephase or three-phase output.
SOLAR300 - SOLAR300N CAUTION When SOLAR300N is set in order to use MPP300 as a remote unit, ALL connections relevant to electrical quantities (voltages and currents) must be carried out on unit MPP300. SOLAR300N must have no voltage nor current connected to its inputs. The maximum voltage for the inputs of MPP300 is 1000VDC between inputs VDC1, VDC2, VDC3 and 600VAC between inputs VAC1, VAC2, VAC3. Do not measure voltages exceeding the limits given in this manual.
SOLAR300 - SOLAR300N CAUTION BEFORE CONNECTING THE DC CLAMPS TO THE CONDUCTORS Switch on the clamp, check the LED indicating the status of the clamp’s internal batteries (if present), select the correct range, press the ZERO key on the DC clamp and check on the display of SOLAR300N the actual zeroing of the corresponding Idc value (values up to 0.02A are acceptable). 10. Fig.
SOLAR300 - SOLAR300N 18. On SOLAR300N, press key F3 to access the second screen which contains the values of the output DC parameters of the strings according to the number of DC inputs set (see §5.3.2.5). In particular, in this screen: Vdcx = dc voltage of string x. Idcx = dc current of string x. Pdx = dc power of string x. We recommend checking that the values of the electrical parameters (Vdc, Idc, Pdc) are consistent with the system being measured.
SOLAR300 - SOLAR300N 22. At any time while recording it will be possible to analyze its current status by selecting the button Saved data management in the GENERAL MENU. The following information will be shown: a. starting date and time of recording b. the value set for the integration period c. the number of periods elapsed from the beginning of the recording d. the remaining memory capacity for recording Press the ESC key to exit the screen 23.
SOLAR300 - SOLAR300N 32. To stop testing, press the F1 key on the instrument SOLAR300N and confirm with ENTER that you want to stop recording. 33. The display of SOLAR300N will show various messages indicating the different phases of data transfer to the main unit. 34.
SOLAR300 - SOLAR300N 7.6. RECORDING IN A PV-1 SYSTEM WITH REMOTE UNIT SOLAR-01 CAUTION The maximum voltage between inputs D1, D2, A1, A2 and A3 is 1000V / CAT IV 600V to earth. Do not measure voltages exceeding the limits indicated in this manual.
SOLAR300 - SOLAR300N 6. Check that the active power Pac is positive and that the power factor Pf corresponds to the load (typically equal to 1.00 for measures made downstream the inverter in photovoltaic systems). In case of negative values of the active power open the clamp, rotate it by 180° and connect it again to the conductor 7. Turn on the SOLAR-01 unit by means of the relevant key on the unit itself. SOLAR-01 will switch to stand-by mode (STATUS LED flashing) 8.
SOLAR300 - SOLAR300N 7.7. RECORDING IN A PV-1 SYSTEM WITH REMOTE UNIT SOLAR-02 CAUTION The maximum voltage between inputs D1, D2, A1, A2 and A3 is 1000V / CAT IV 600V to earth. Do not measure voltages exceeding the limits indicated in this manual.
SOLAR300 - SOLAR300N 5. Connect the AC current clamp to the Phase L1 conductor by respecting the direction of the arrow on the clamp itself as indicated in Fig. 249. Connect the output of the clamp to the I1 input of the instrument. 6. Supply the electric system considered in case it was temporarily put out of service for connecting the instrument 7. Check that the active power Pac is positive and that the power factor Pf corresponds to the load (typically equal to 1.
SOLAR300 - SOLAR300N 7.8. RECORDING IN A PV-3 SYSTEM WITH REMOTE UNIT SOLAR-01 CAUTION The maximum voltage between inputs D1, D2, A1, A2 and A3 is 1000V / CAT IV 600V to earth. Do not measure voltages exceeding the limits indicated in this manual.
SOLAR300 - SOLAR300N 6. Check that the active power Pac is positive and that the power factor Pf corresponds to the load (typically equal to 1.00 for measures made downstream the inverter in photovoltaic systems). In case of negative values of the active power, check the connection of the amperometric clamps.
SOLAR300 - SOLAR300N 7.9. RECORDING IN A PV-3 SYSTEM WITH REMOTE UNIT SOLAR-02 CAUTION The maximum voltage between inputs D1, D2, A1, A2 and A3 is 1000V / CAT IV 600V to earth. Do not measure voltages exceeding the limits indicated in this manual.
SOLAR300 - SOLAR300N 5. Connect the AC clamps to the Phase L1, L2, L3 conductors by respecting the direction of the arrow on the clamps as indicated in Fig. 251. Connect the output of the clamps to the I1, I2, I3 input of the instrument respectively 6. Supply the electric system considered in case it was temporarily put out of service for connecting the instrument 7. Check that the active power Pac is positive and that the power factor Pf corresponds to the load (typically equal to 1.
SOLAR300 - SOLAR300N 7.10. RECORDING PV SYST. WITH SINGLE/MULTI MPPT – SINGLE/THREE PHASE AC The instrument SOLAR300N, used together with remote units SOLAR-02 and MPP300 (optional), allows carrying out long recordings on PV systems characterized by 1 or more PV fields (with the same direction and inclination), each connected to an MPPT of the inverter (see § 10.3) and single-phase or three-phase output.
SOLAR300 - SOLAR300N CAUTION When SOLAR300N is set in order to use MPP300 as a remote unit, ALL connections relevant to electrical quantities (voltages and currents) must be carried out on unit MPP300. SOLAR300N must have no voltage nor current connected to its inputs. The maximum voltage for the inputs of MPP300 is 1000VDC between inputs VDC1, VDC2, VDC3 and 600VAC between inputs VAC1, VAC2, VAC3. Do not measure voltages exceeding the limits given in this manual.
SOLAR300 - SOLAR300N 9. Connect the output connector of the DC clamp to the IDC1 input of unit MPP300. CAUTION BEFORE CONNECTING THE DC CLAMPS TO THE CONDUCTORS Switch on the clamp, check the LED indicating the status of the clamp’s internal batteries (if present), select the correct range, press the ZERO key on the DC clamp and check on the display of SOLAR300N the actual zeroing of the corresponding Idc value (values up to 0.02A are acceptable). 10.
SOLAR300 - SOLAR300N 18. On SOLAR300N, press key F3 to access the second screen which contains the values of the output DC parameters of the strings according to the number of DC inputs set (see §5.3.2.5). In particular, in this screen: Vdcx = dc voltage of string x. Idcx = dc current of string x. Pdx = dc power of string x. We recommend checking that the values of the electrical parameters (Vdc, Idc, Pdc) are consistent with the system being measured.
SOLAR300 - SOLAR300N 22. At any time while recording it will be possible to analyze its current status by selecting the button Saved data management in the GENERAL MENU. The following information will be shown: a. starting date and time of recording b. the value set for the integration period c. the number of periods elapsed from the beginning of the recording d. the remaining memory capacity for recording Press the ESC key to exit the screen 23.
SOLAR300 - SOLAR300N 7.11. USING THE METER IN A SINGLE PHASE SYSTEM CAUTION The maximum voltage between inputs D1, D2, A1, A2 and A3 is 1000V / CAT IV 600V to earth. Do not measure voltages exceeding the limits indicated in this manual. If these voltage limit values are exceeded, the user may be exposed to electrical shocks and the instrument could get damaged If possible, before connecting the meter to the electrical equipment to be tested turn the power supply off Fig.
SOLAR300 - SOLAR300N 7.12. USING THE METER IN A THREE PHASE 4 WIRE SYSTEM CAUTION The maximum voltage between inputs D1, D2, A1, A2 and A3 is 1000V / CAT IV 600V to earth. Do not measure voltages exceeding the limits indicated in this manual. If these voltage limit values are exceeded, the user may be exposed to electrical shocks and the instrument could get damaged If possible, before connecting the meter to the electrical equipment under test turn the power supply off Fig.
SOLAR300 - SOLAR300N 7.13. USING THE METER IN A THREE PHASE 3 WIRE SYSTEM CAUTION The maximum voltage between inputs D1, D2, A1, A2 and A3 is 1000V / CAT IV 600V to earth. Do not measure voltages exceeding the limits indicated in this manual. If these voltage limit values are exceeded, the user may be exposed to electrical shocks and the instrument could get damaged If possible, before connecting the meter to the electrical equipment under test turn the power supply off Fig.
SOLAR300 - SOLAR300N 7.14. USING OF METER IN A THREE PHASE 3 WIRE ARON SYSTEM CAUTION The maximum voltage between inputs D1, D2, A1, A2 and A3 is 1000V / CAT IV 600V to earth. Do not measure voltages exceeding the limits indicated in this manual. If these voltage limit values are exceeded, the user may be exposed to electrical shocks and the instrument could get damaged If possible, before connecting the meter to the electrical equipment under test turn the power supply off Fig.
SOLAR300 - SOLAR300N 8. MAINTENANCE 8.1. GENERAL For their use and storage, follow the recommendations and instructions of this manual in order to avoid possible damages or dangers. Never use the instrument in environments with a high humidity or temperature. Do not expose the meter to direct sunlight. Always turn off the instrument after use. 8.2.
SOLAR300 - SOLAR300N 8.3.1. Replacement internal battery CAUTION Only qualified technicians should operate the instrument. Before replacing the batteries disconnect the test leads from circuit under voltage in order to avoid electrical shocks. 1. 2. 3. 4. 5. 6.
SOLAR300 - SOLAR300N 9. TECHNICAL SPECIFICATIONS 9.1. TECHNICAL FEATURES Accuracy is given as: [% reading + (number of digits)*resolution] at 23°C 5°C ; <80%RH DC Voltage – PV Systems Range Accuracy 0.0 1000.0V (0.5%rdg+2dgt) Resolution 0.1V Input impedance 10M Voltage values < 20.0V are considered zero by meter TRMS AC Phase-Neutral/Phase-Earth/Phase-Phase Voltage – Single/ Three-phase PV systems Range Accuracy Resolution Input impedance 0.0 600.0V 0.1V (0.5%rdg+2dgt) 10M 0.01000.
SOLAR300 - SOLAR300N AC TRMS Current (with external STD transducer clamp) Range Accuracy Resolution 0.01000.0mV (0.5%rdg+0.06%FS) 0.1mV Input impedance 510k Overload protection 5V Measure performed with voltage output =1VAC with nominal current measured by clamp ; Max crest factor = 3 Current values < 0.1% of full scale (FS) are considered zero by meter Current through FLEX transducer – NPV Systems – 300A range Range Accuracy Resolution Input impedance Overload protection 0.0 49.9A 50.
SOLAR300 - SOLAR300N Energy – Single-phase and Three-phase systems – 50/60Hz Range Parameter Resolution FS clamp Accuracy (*) [Wh,VArh,VAh] [Wh,VArh,VAh] [Wh,VArh,VAh] (0.7%rdg) @ 0 – 999.9k 0.1 – 0.001k FS 1A (Pf=1,Vmis>200V,Imis>10%FS) 0.000 – 99.99k 0.001k – 0.01k 1A< FS 10A (0.7%rdg) @ Active energy 10A< FS < 200A 0.00 – 999.9k 0.01k – 0.1k (Pf=1, Vmis > 200V, Reactive energy Imis>10A if FS=200A) Apparent energy 0.1k – 0.01M (0.7%rdg +3dgt) @ (Pf<1 or 200A< FS 3000A 0.0 – 9.
SOLAR300 - SOLAR300N 9.2.
SOLAR300 - SOLAR300N 10. APPENDIX – THEORETICAL OUTLINES 10.1. TESTING PV SYSTEMS According to the requirements of the laws in force, the result of the test depends on settings about Temperature effects compensation and PRp calculations : Corr.Type Tmod Tcel value Tcel = PV Module Temp. measured Tcel = PV module Temp. calculated PRp calculation PRp Tamb Gp or Tenv Tcel Tamb NOCT 20 800 nDC Tcel = PV Module Temp.
SOLAR300 - SOLAR300N The final OUTCOME can be: Non-displayable: if the obtained values are inconsistent (e.g. PRp >1.15) or if irradiation has never reached a steady value > minimum threshold set. The maximum performance point (PRp) of the system The highest performance (maximum value of PRp) is detected according with previous relationships. 10.2.
SOLAR300 - SOLAR300N 10.3. NOTES ON MPPT (MAXIMUM POWER POINT TRACKER) Solar irradiation on a surface such as the surface of a photovoltaic system has extremely variable characteristics, since it depends on the position of the sun with respect to the surface and on atmospheric conditions (typically, on the presence of clouds).
SOLAR300 - SOLAR300N The reason why MPPTs are used is simple: a photovoltaic system without MPPTs may operate anyway; however, with the same solar irradiation, it provides less energy. There are inverters with 1, 2 or also 3 inbuilt MPPTs available on the market. Typically, the inverters with more than one MPPT are used in systems where: - The different photovoltaic systems it consists of “forcibly” have different inclinations or directions.
SOLAR300 - SOLAR300N 10.5. VOLTAGE AND CURRENT HARMONICS 10.5.1.
SOLAR300 - SOLAR300N 10.5.2. Limit values for harmonic voltage EN50160 standard fixes the limits for the harmonic voltages, which can be introduced into the network by the power supplier. In normal conditions, during any period in a week, 95% of the RMS values of each harmonic voltage, mediated on 10 minutes, shall be lower than or equal to the values stated in the following table.
SOLAR300 - SOLAR300N 10.5.4. Presence of harmonics: consequences In general, even harmonics, i.e. the 2nd, 4th etc., do not cause problems. Triple harmonics, odd multiples of three, are added on the neutral (instead of deleting each other) thus creating a condition of overheating of the wire which is extremely dangerous.
SOLAR300 - SOLAR300N 10.6. INRUSH CURRENTS The SOLAR300N meter permits the real time detection of inrush current events, typical of start-up of electrical machines and also for other industrial applications (e.g. troubleshooting problem regarding loads switching, correct calculation of protection devices, oscillating currents, etc…) as shown in the following pictures: Fig. 258: Parameters of standard inrush current event Fig.
SOLAR300 - SOLAR300N FIX: The meter detect and recording a event each time the TRMS value of current, calculated on each half period (10ms @ 50Hz, 8.3ms @ 60Hz), it’s over the limit threshold defined by user. A new event is detected by meter always if the current value decrease under the set limit threshold. VAR: The meter detect and recording a event each time the TRMS value of current, calculated on each half period (10ms @ 50Hz, 8.
SOLAR300 - SOLAR300N 10.8. SUPPLY VOLTAGE UNBALANCE In normal conditions the supply voltage and the final loads are perfectly balanced. Unbalances are possible in trouble situations (low insulation) and/or phase circuits interruptions. Moreover, in single phase systems, the balance can be only statistic. In order to design a correct protection installation a thorough study of anomalous conditions on three phase systems was performed.
SOLAR300 - SOLAR300N 10.9. VOLTAGE FAST TRANSIENTS (SPIKES) The meter considers all the phenomena associated to the phase voltage as voltage spikes which have the following properties: Fast slope variations of voltage waveforms. Exceeding a limit threshold fixed by user before starting a recording. The maximum number of recorded events in a half period (10ms @ 50Hz, 8.3ms @ 60Hz) is 4. The maximum number of recorded events by meter during a recording is 20000.
SOLAR300 - SOLAR300N and that during the detectable time interval defined as: 32 x 5s = 160s. 32 x 78s = 2.5ms. 32 x 65s = 2.1ms. the positive and negative difference (defined DELTA+ and DELTA- respectively) it’s over the “windows” defined by the limit threshold set by user. Based to the above description, downloading the saved data from meter to PC using the standard TopView software, the below parameters are shown: Num.
SOLAR300 - SOLAR300N 10.10.
SOLAR300 - SOLAR300N Note: It shall be noted that the expression of the phase Reactive Power with no sine waveforms, would be wrong. To understand this, it may be useful to consider that both the presence of harmonics and the presence of reactive power produce, among other effects, an increase of line power losses due to the increased current RMS value. With the above given relation the increasing of power losses due to harmonics is added to that introduced by the presence of reactive power.
SOLAR300 - SOLAR300N Value Pact Preact Pf 0 -1 Description The active power (positive or negative) is defined in the panel and therefore acquires the value of the active power in that moment. The reactive power (inductive or capacitive, positive or negative) is defined in the panel and therefore acquires the value of the reactive power in that moment. The power factor (inductive or capacitive, positive or negative) is defined in the panel and therefore acquires the value of the power factor in that moment.
SOLAR300 - SOLAR300N 10.11. MEASURING METHOD: OUTLINES The meter is capable of measuring: voltages, currents, active powers, inductive and capacitive reactive powers, apparent powers, inductive and capacitive power factors, energies, analogical or pulse parameters. All these parameters are analysed in a digital way for each phase (voltage and current) and calculated based on formulas of the previous sections. 10.11.1. Integration period The storage of all the data would require a huge memory capacity.
SOLAR300 - SOLAR300N 11. AFTER-SALE SERVICE 11.1. WARRANTY This instrument is guaranteed against any defects in material and manufacturing, in compliance with the general sale terms and conditions. During the warranty period all defective parts may be replaced, but the manufacturer reserves the right to repair or replace the product. If the instrument is to be returned to the after-sale service or to a dealer, its transport expenses must be borne by the customer. Shipment shall be however agreed upon.
Via della Boaria 40 48018 – Faenza (RA)- Italy Tel:+39-0546-621002 (4 linee r.a.) Fax:+39-0546-621144 Email: ht@htitalia.it http://www.ht-instruments.