
Instruction Manual

I-V400 - SOLAR I-V
EN - 62
7.3.2.2. View data – Graphic screens of I-V curve
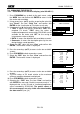
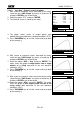
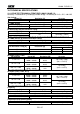
1. With screen of numerical values relative to standard
conditions (STC) select the item “I-V Graph” by means of
arrow key and press ENTER or the arrow key .
2. Select the “STC” option and press ENTER.
3. The herewith screen is shown by the meter.
15/05/10 15:34:26
Voc 4
8
.
0
V
Vmpp 39.8 V
Im
pp
5.
2
4 A
Isc 5.
60
A
Pmax
208
W
FF
0
.7
8
%
DPmax
S
T
C
O
P
C
–
A
v
g
Data
O
P
C
I-V
G
ra
p
h
PWR
G
ra
p
h -
O
K
Select
I – V
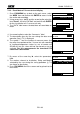
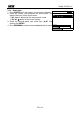
4. The graph is the I-V curve relative to the object under test
translated to the standard conditions (STC) and referred
to 1 module.
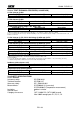
5. Press ESC/MENU key to exit the screen and to go back
to the memory section.
15/05/10 15:34:26
I-V
G
ra
p
h
@
S
T
C
–
O
K
Select
I – V
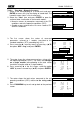
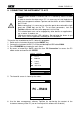
6. With screen of numerical values measured by meter
select the item “I-V Graph” by means of arrow key and
press ENTER or the arrow key .
7. Select the option “OPC – Avg” and press ENTER. The I-
V curve graph of a string measured at the real operative
conditions (OPC) and displayed by the meter is averaged
on a single module.
8. Press ESC/MENU key to exit the screen and to go back
to the memory section
15/05/10 15:34:26
I-V
G
ra
p
h
@
O
P
C
-
A
v
g
Select
I – V
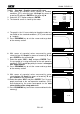
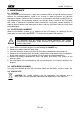
9. With screen of numerical values measured by meter
select the item “IV Graph” by means of arrow key and
press ENTER or the arrow key .
10. Select the option “OPC” and press ENTER. The I-V curve
graph measured at the real operative conditions (OPC)
and displayed by the meter corresponds to the total
value relative to the string under test.
11. Press ESC/MENU key to exit from screen and back to the
memory §
15/05/10 15:34:26
I-V
G
ra
p
h
@
O
P
C
Select
I – V