
Instruction Manual

I-V400 - SOLAR I-V
EN - 61
7.3.2.1. View data – Numerical screens
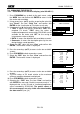
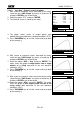
1. Select a row corresponding to a saved result and press
ENTER to access the § for the display of stored data. The
herewith screen shows a list of saved tests.
2. Select the “View” item and press ENTER to open the
section of data visualization in the herewith modes:
Numeric screens of parameters measured at the STC
conditions and at the operative conditions (OPC)
Graphic screens relative to the I-V curves saved at STC
and OPC conditions
15/05/10 15:34:26
MEM INS STR MOD
001 001 001 001
002 001 001 002
View
Delete
Select
MEM – IV
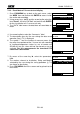
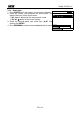
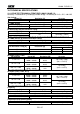
3. The first screen shows the values of measured
parameters, referred to 1 module, translated to the
standard conditions (STC) according to § 6.2.3
4. Press arrow key , select by means of arrow keys (,)
the option “OPC – Avg” and press ENTER.
15/05/10 15:34:26
Voc 48.0 V
Vmpp 39.8 V
Impp 5.24 A
Isc 5.60 A
Pmax 208 W
FF 0.78 %
DPmax STC
OPC – Avg
Data OPC
I-V Graph
PWR Graph - OK
Select
I – V
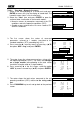
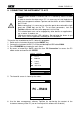
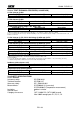
5. The meter shows the values measured on a string at the
real operating conditions (OPC). The values are averaged
on a single module (corresponding to the total values
should the string be made of a single module).
6. Press arrow key in the first screen, select the option
“OPC” by means of arrow keys (,) and press ENTER.
15/05/10 15:34:26
Voc 46.9 V
Vmpp 39.0 V
Impp 4.85 A
Isc 5.22 A
Pmax 189 W
FF 0.77 %
Irr 927 W/m2
Tc 25.1 °C
Results
@
O
P
C
–
A
v
g
Select
I – V
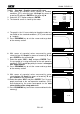
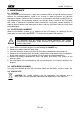
7. The meter shows the total values measured at the real
operating conditions (OPC) relative to the string under
test.
8. Press ESC/MENU key to exit and go back to the previous
screen.
15/05/10 15:34:26
Voc 46.9 V
Vmpp 39.0 V
Impp 4.85 A
Isc 5.22 A
Pmax 189 W
FF 0.77 %
Irr 927 W/m2
Tc 25.1 °C
Results
@
O
P
C
Select
I – V