
User Manual


HT155 - HT157
EN - 43
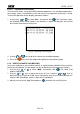
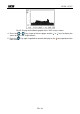
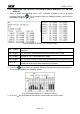
Fig. 45: Display of distribution graphic of the "24H" analysis values
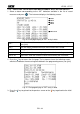
4. Press the “ ” or “ ” keys to go to the next pages and the “” or “” keys to display the
values of data in the single intervals
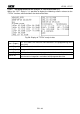
5. Press the “
” key again to go back to numerical display or the “ ” key to go back to the
initial screen