
MSA 2060 Storage Array

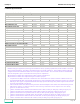
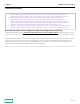

Table Of Contents

QuickSpecs
HPE MSA 2060 Storage Array
Technical Specifications
Page
25
MSA 2060 End-to-End Performance Figures
Storage Model
MSA 2060 FC
MSA 2060 iSCSI
MSA 2060 SAS
Host Protocol
16Gb FC
2
10GbE iSCSI
2
12Gb SAS
2
Drive Technology
HDD
SSD
HDD
SSD
HDD
SSD
MSA 2060 RAID1 / RAID 10 Performance Results
3,4,5,6,7
Random Reads IOPs
49,900
300,900
43,400
221,100
49,900
294,200
Random Writes IOPs
31,600
161,800
31,600
132,600
31,700
160,800
Random Mix 60/40 IOPs
40,100
226,300
39,800
175,100
40,100
223,900
Sequential Reads MB/s
1
8,400
12,100
5,500
7,700
8,400
12,100
Sequential Writes MB/s
1
4,000
5,300
3,700
4,400
4,000
5,300
MSA 2060 RAID 5 Performance Results
8,9,10,11
Random Reads IOPs
48,100
275,400
41,300
211,100
48,000
269,500
Random Writes IOPs
15,500
60,500
15,600
55,000
15,600
60,500
Random Mix 60/40 IOPs
27,300
112,500
27,200
98,000
27,100
112,500
Sequential Reads MB/s
1
8,000
11,800
5,400
7,700
8,000
11,800
Sequential Writes MB/s
1
5,800
6,700
4,500
4,500
5,800
6,700
MSA 2060 RAID 6 Performance Results
12,13,14,15
Random Reads IOPs
48,900
273,000
42,000
210,200
48,800
266,100
Random Writes IOPs
12,000
52,200
12,000
47,000
12,000
52,000
Random Mix 60/40 IOPs
20300
101,800
20,300
89,100
20,300
101,300
Sequential Reads MB/s
1
8,000
12,100
5,500
7,800
8,000
12,100
Sequential Writes MB/s
1
5,700
6,300
4,300
4,400
5,700
6,300
MSA 2060 MSA-DP+ Performance Results
16,17,18
Random Reads IOPs
48,600
267,600
41,800
207,700
48,600
262,000
Random Writes IOPs
11,700
52,300
11,800
47,400
11,800
52,400
Random Mix 60/40 IOPs
20,300
101,900
20,300
89,200
20,300
101,200
Sequential Reads MB/s
1
8,000
12,100
5,400
7,800
8,000
12,100
Sequential Writes MB/s
1
5,400
6,300
4,300
4,400
5,400
6,300
Notes:
- Number and type of applications, drive type and number of drives, operating system used, and the number of hosts will
affect overall performance. This table is provided strictly as a test-lab comparison. These numbers reflect a full array
configuration with the maximum number of front-end ports and controllers. The test results shown for the HPE MSA
2060 are designed to give a conservative reference point for comparisons.
- All performance numbers were captured using dual controller configurations.
- All performance numbers were captured using four volumes per pool.
o
1
Sequential tests (MB/s) are based on 256K block sizes and random tests (IOPS) are based on 8K block sizes. For
sequential workloads with a queue depth greater than 1, each sequential stream is targeted to operate on a separate
LBA range. Other types of sequential workloads that target specific LBA ranges may achieve higher results. Results
cannot be expected with a single host.
o
2
Fibre Channel results were measured using 16 Gb FC Host Bus Adapters. SAS results were measured using 12 Gb
SAS Host
Bus Adapters. 10 GbE iSCSI results were measured using 10GbE iSCSI Host Bus Adapters. Hosts were directly
attached to the HPE MSA 2060 array.
o
3
RAID 1 Solid State Drive random read and mixed results: 4 SSDs, 2 SSDs per disk group, 1 disk group per pool.
o
4
RAID 10 Solid State Drive random write results: 8 SSDs, 4 SSDs per disk group, 1 disk group per pool.
o
5
RAID 10 Sold State Drive sequential results: 20 SSDs, 10 SSDs per disk group, 1 disk group per pool.
o
6
RAID 10 Hard Disk Drive sequential results: 96 10K HDDs, 12 drives per disk group, 4 disk groups per pool.
o
7
RAID 10 Hard Disk Drive random results: 240 10K HDD, 10 drives per disk group, 12 disk groups per pool.
o
8
RAID 5 Solid State Drive random results: 6 SSDs, 3 SSDs per disk group, 1 disk group per pool.