
Setup and Install
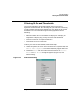

Using HP WebQoS
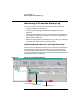
Monitoring SLOs and the History Log
Chapter 4 95
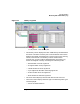
• Status column — Displays the color coded status associated with
SLOs and thresholds.
— Red: Violation. The SLO or threshold objective is in violation and
no corrective actions are being executed by WebQoS.
— Yellow: At risk. The SLO or threshold objective is in violation, but
WebQoS is executing a corrective action to try and bring it back
into compliance.
Only one SLO or threshold can be yellow on any given system, as
only one corrective action is executed at a time. If you select the
Services View, the SLO status for SLOs on several systems (if they
are configured) would be shown.
— Green: In compliance. The SLO or threshold objective is being
met.
— Blue: Inactive. The SLO is inactive; WebQoS is disabled.
— Aqua: Not connected. The SLO is not connected, meaning that the
SLO is not currently connected to the system, or that the system is
not connected to a web server.
The management user interface updates the status display every
30 seconds. An SLO can show a status of “not connected” if the
display has not yet been updated. Click on another site, service, or
system to get an updated status.
— Orange: Never connected. The SLO was never connected. When
you configure a site, the WebQoS configuration database and the
web server running that site are notified. If the web server is
off-line, the WebQoS Service Control Operator (SCO) tries to
contact the site later. In the mean time, the site status is defined
as “never connected.”
— Red: In error. The SLO or threshold is in error. This is most likely
a state for the site that is inherited by the SLOs. It usually means
the web server is not functioning properly. For example, the web
server is unable to start up or shut down completely.
NOTE If there is a problem with the web server, for example if the web
server is unable to start or shut down completely, the SLOs inherit
this problem and the SLO status is represented with a blue, aqua,
orange, or red color code.