
Setup and Install

Customizing and Using HP OpenView with HP WebQoS
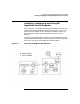
Installing, Configuring and Using PerfView
Chapter 5130
b. Restart or start the MeasureWare agent by typing
mwa restart.
6. Log the data with the following command (assuming iservice is the
service name and ISERVICE is the unique name). Note that the
command should contain no carriage returns.
/opt/webqos/bin/dsi_start.sh SERVICE ISERVICE
iservice
NOTE When you delete the service, you need to kill the mw_stats and dsilog
process by running /opt/webqos/bin/dsi_stop.sh ISERVICE iservice.
Viewing Graphs in PerfView
You can view all of the WebQoS service and site statistics in PerfView,
which allows graphs-on-demand for particular metrics over minutes,
hours, days, or weeks. To view the statistics, you must first configure the
WebQoS system, as described in the previous sections “Logging WebQoS
Site Data” on page 128 and “Logging WebQoS Service Data” on page 129.
To create a PerfView graph, follow these steps:
1. On the system where PerfView is installed, enter pv at the shell
prompt.
2. When the PerfView main window appears, click on Data Sources,
and select Manage.
3. In the PerfView Systems window, do the following:
a. Click on All Known Systems.
b. Select one or more system names in theSystems in Group pane,
and click Connect Systems.
If no systems are listed, select Manage > Add. Enter the system
name in the Add System dialog, and click Add, then OK.
c. Close this window and return to the PerfView main window.
4. From the Graphs menu select Create New Graph.
This opens a new window listing your data sources by system name
and classification.