
Setup and Install

Using HP WebQoS
Displaying Service Performance Statistics
Chapter 4110
Statistics from the menu bar. The Service Performance
Statistics window displays.
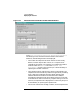
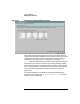
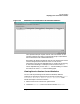
3. Select the Session Control Statistics tab from the Service
Performance Statistics window (Figure 4-9, Service Session
Control Statistics).
Figure 4-9 Service Session Control Statistics
The screen shows the percentage of new sessions admitted, deferred,
redirected, or rejected for the service during the previous 30 minutes.
This is shown per request class. The actual number of new sessions
admitted, deferred, redirected, or rejected is shown in parentheses.
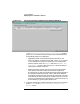
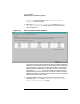
For example, 100% (6000) means that 100% of new sessions were
admitted during the last 30 minutes. The actual number of sessions
admitted was 6000. The session control statistics screen is refreshed
with new values every 30 seconds.
4. To display detailed session control statistics for each site in the
service choose Details in the Service Performance Statistics
Session Control Statistics screen.