
Setup and Install

Using HP WebQoS
Displaying Service Performance Statistics
Chapter 4 109
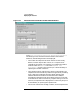
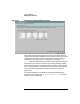
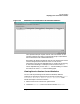
Figure 4-8 Detailed Service Performance SLO Related Statistics
The response times per request class for each site and the current
number of sessions are shown in milliseconds (Figure 4-8, Detailed
Service Performance SLO Related Statistics).
Each table row displays thedata forone site. For example, if there are
10 sites configured, there will be 10 rows. You can sort the
information in the columns alphabetically or numerically by clicking
on the column heading. For example, to list the sites in the Site
column alphabetically, click on the Site column heading. To reverse
the order, click on the Site column heading again.
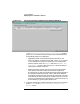
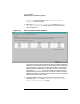
Viewing Service Session Control Statistics
You can view the percentage of new sessions admitted, deferred,
redirected, or rejected per request class for the service from the Service
Performance Statistics Session Control Statistics screen.
Follow these steps to view the statistics:
1. Select a service in the Services or Systems view.
2. Choose the Statistics task icon from the task bar or Actions: