
Setup and Install


Using HP WebQoS
Displaying Service Performance Statistics
Chapter 4 107
Displaying Service Performance Statistics
HP WebQoS provides the following service statistics:
• Aggregate number of unexpired concurrent sessions for the service.
• Average response times per Request Class for the service.
• Percentage of new sessions admitted, deferred, redirected, or rejected
for the service during the previous 30 minutes.
• Defer statistics, such as aggregate number of outstanding deferred
sessions, current defer time that defer sessions are receiving, and the
average deferral time for the previous 30 minutes.
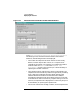
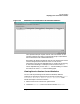
Viewing Service SLO Related Statistics
If you have enabled URL encoding and configured the BroadVision
system and user names in the /etc/opt/webqos/qos.conf file, the
statistics displayed in the SLO Related Statistic screens are based on
BroadVision’s session counts.
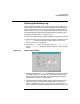
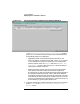
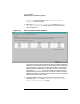
Follow these steps to view the service performance statistics:
1. Select a service in the Services or Systems view.
2. Choose the Statistics task icon from the task bar or Actions:
Statistics from the menu bar.