
Administrator's Guide

Logs and Filters
SLOs, Thresholds, and the History Log
Chapter 7 99
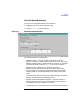
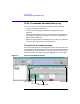
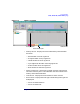
Figure 7-2 History Log View
• Severity column - Displays the color-coded severity associated with
the events.
— Red: Number of critical log entries
— Orange: Number of major log entries
— Yellow: Number of minor log entries
— Cyan (light blue): Number of warning log entries
— Green: Number of normal log entries
— Blue: Number of unknown log entries
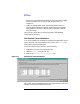
• Status summary bar - Displays the number of events of each status.
The status summary bar is color-coded with the same scheme as the
severity column described above.
• Time column - Displays the time and date an event occurred.
• Event column - Displays the event type. The following event types can
be displayed:
— SLO or threshold violation
— SLO or threshold risk
Severity Column
Status Summary Bar
Pulldown List