
Administrator's Guide


Statistics
Service Statistics
Chapter 688
example, to list the sites in the Site column alphabetically, click on the
Site column heading. To reverse the order, click on the Site column
heading again.
Service Session Control Statistics
To view the session control statistics, do the following:
1. Highlight a service in the services/systems view.
2. Choose Statistics from the task bar.
3. Click on the Session Control Statistics tab.
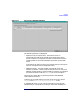
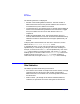
Figure 6-2 Service Session Control Statistics
This screen shows how WebQoS executes corrective actions to control the
number of new sessions admitted to the service.
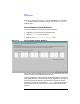
Statistics displayed are the percentage of admitted, deferred, redirected,
and rejected sessions, broken down by request classification, during the
past 30 minutes. Each statistic also includes the number of sessions
(shown in parentheses). For example, 90% (117) means that 90% of all
new sessions (or 117 new sessions) were admitted during the last 30
minutes.