
User's Manual

Virtual Connect modules 234
• Received Non-Unicast Packets (pkts/s)
• Transmitted Packets (pkts/s)
• Transmitted Non-Unicast Packets (pkts/s)
Some conditions can clear existing Throughput Statistics for a particular module:
• Disabling the collection of Throughput Statistics clears all existing samples.
• Changing the sampling rate clears all existing samples.
• Power cycling a VC-Enet module clears all Throughput Statistics samples for that module.
Throughput Statistics are not supported by VC-FC modules. FC-capable ports configured for FC are not
supported for Statistics Throughput. These ports are excluded from the port selection list.
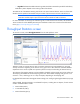
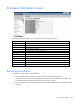
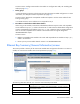
The following table describes the available actions on the Throughput Statistics screen. Clicking on the left
navigation tree or menus on the top of the screen resets the port selection and the chart.
Task Action
View settings
The settings section contains the current Throughput Statistics configuration,
including the enable state and sampling rate.
Edit settings
Click Edit to go to the Ethernet Settings (Advanced Settings) screen ("Ethernet
Networks (Advanced Settings)" on page 97) to make configuration changes.
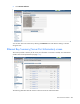
Add a port
Click Add. A menu appears. Select an enclosure, and then select a bay to view
the available ports. Ports displayed include uplink, downlink, and stacking link
ports. Subports are selected when selecting the physical port associated with
the subports. Up to four ports can be added. After adding four ports, the Add
option is disabled. To add more ports, remove one of the added ports.
Remove a port
Click the Remove icon.
Select a port
Click the checkbox for the port.
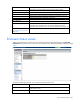
Select statistics
When there at least one port is selected, the statistics options are enabled. A
maximum of four ports is supported in the chart. When a single port selected,
available statistics are Bits and Packets. If the Bits option is selected, the
available statistics are Received Mb/s, Transmitted Mb/s, or both. If the
Packets option is selected, the available statistics are Received packets/s,
Received non-unicast packets/s, Transmitted Packets, and Transmitted
non-unicast packets. These statistics can be combined in the same chart. When
multiple ports are selected, only one statistic is supported in the chart.
Generate a chart
Click Chart.
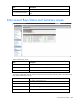
Print a chart
Right-click the chart, and then select Print.
Refresh data in the chart
Click Refresh at the button of the chart. The Refresh option will be disabled
according to the sampling rate. It becomes enabled after the time frame
established by the sampling rate has elapsed.
Zoom selected chart range
To draw a zoom area, click on the chart and drag the mouse until all the data
points of interest are highlighted. A new chart is generated focusing on the
points selected after releasing the mouse button.
Zoom reset
Click Reset at the bottom of the chart. The original chart appears.
View sample time stamp
The sample time stamp is located in the title bar of the chart.
Collapse or expand the chart
settings panel
Click the Collapse/Expand arrow in the bar dividing the chart settings and the
chart.