
Administrator's Guide
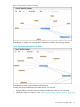
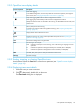

3.13.2 OpenFlow trace display details
DescriptionScreen component
Starts trace logging.
In the default configuration, the trace stops after ten seconds have passed. (To change the
trace interval, see “Changing the OpenFlow trace interval ” (page 48).)
Stops trace logging before the end of the configured trace interval.
Trace logging stops automatically at the end of the configured trace interval.
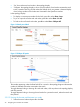
Multiple consecutive traces can be held in the trace log. To add additional trace results, start
another trace.
Clears (resets) the current trace log.
To preserve the contents of the trace log before clearing it, see “Exporting the OpenFlow
trace log” (page 46).
Displays details of the selected trace event.
Copies the trace log into a CSV (comma-separated values) file. See see “Exporting the
OpenFlow trace log” (page 46).
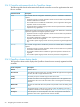
Export
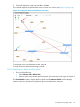
The time the message event was generated.Time
The event type. For example:Event
CkPt Indicates a check point in the trace log, such as the starting or stopping of a trace
operation.
Rx Indicates an OpenFlow message recieved by the controller (from a datapath).
Tx Indicates an OpenFlow message sent from the controller (to a datapath).
The DPID (data path ID) of the data path associated with the event.DPID
The trace message.Message
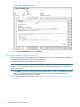
3.13.3 Starting, stopping, or clearing OpenFlow trace
Use the buttons above the Time field to control trace operations (see “OpenFlow trace display
details” (page 45)).
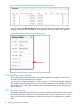
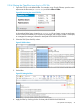
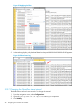
3.13.4 Displaying trace event details
1. Select the event you want to examine.
2. Click . Alternatively, double-click on the event.
The Event Detail dialog box is displayed.
3.13 OpenFlow trace display 45