
Administrator's Guide

1. From the Configurations screen, under Component, select the
com.hp.sdn.adm.mgr.impl.AppManager component.
2. Click Modify.
The Modify Configuration dialog box appears.
3. Change the “verifyZips” key value to “False” to enable checking.
4. Click Apply.
NOTE: To download an application with this check enabled, the public certificate used to
recognize the signed zip file must be installed in the sdnjar_trust.jks truststore. See “Adding
certificates to the jar-signing truststore ” (page 68).
3.10.5 Exporting the support logs
The Export operation:
1. Gathers the set of support log file data from the controller, or in a team environment, all active
controllers in the team, and stores the data as a single compressed archive file:
sdn-all-logs.zip
2. Downloads the archive file from the controller to the default download directory specified by
your browser. For example, in Ubuntu installations, this is usually the Downloads directory.
1. Click Export.
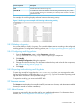
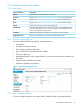
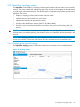
The following menu appears in the lower-left corner of the controller console:
Figure 6 Completion of the export operation
2. When the download completes, you can either resume interaction with the controller or examine
the log by selecting an item from the menu, such as:
• Open a window showing the new log zip file.
• Set the default operation to always open the directory containing the log zip file.
• Show the log zip file in the default directory for receiving downloads.
NOTE: The actions resulting from these choices depend on the browser and operating system,
not on the controller.
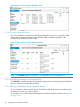
3.11 OpenFlow monitor screen
When the controller is active in an OpenFlow domain, the OpenFlow Monitor enables tracking of
switch traffic summaries, packet traffic per port, and applied flow rules for switches detected in
the controller domain. The main display lists the Data Path IDs for the active switches and the
options for viewing traffic information.
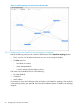
3.11.1 About the OpenFlow monitor
When the controller is active in an OpenFlow domain, the OpenFlow Monitor enables tracking of
switch traffic summaries, packet traffic per port, and applied flow rules for switches detected in
the controller domain. The main display lists the Data Path IDs for the active switches and the
options for viewing traffic information.
36 Navigating the controller user interface