
Administrator's Guide
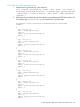

"ip_ident": 0,
"ip_dscp": "CS0",
"ip_ecn": "NOT_ECT"
},
"tcp": {
"tcp_src": 12345,
"tcp_dst": 20
}
}
}
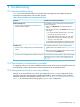
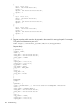
4. Set the observation post on the switch where the destined end host is connected.
post /diag/observations.
NOTE: An alert is generated for an operation such as setting or removing an observation
post. These alerts can be viewed by using the Alert Log in the controller UI.
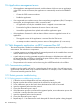
Destination end host ( 00:00:00:00:00:05 ) is connected to switch having dpid as
00:00:00:00:00:00:00:01 . Set up an observation post here using below json as request
parameter
{"observation": {
"dpid": "00:00:00:00:00:00:00:01", // connected switch from /nodes
"packet_uid": "2096432597" //uid from the create /register packet .
}
}
output -
{
"observation": {
"dpid": "00:00:00:00:00:00:00:01",
"packet_uid": " 2096432597"
}
}
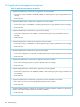
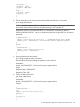
5. Inject the packet onto the network
post /diag/packets/{packet_uid}/action
Use the above URI for generating the packet on to the network.
Parameters:
packet_uid 2096432597 //uid from the create /register packet .
output -
Response Body: 2096432597
Response Code: 200
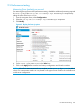
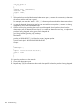
6. Query the observation post
get /diag/observations
parameters :
packet_uid 2096432597 //uid from the create /register packet .
Output:
{
"observations": [
{85
"dpid": "00:00:00:00:00:00:00:01",
"match":[
{
"in_port":9
},
{
11.7 Path diagnostic application via REST command line API 107