
User`s guide


Picturing Financial Problems60
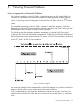
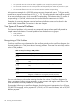
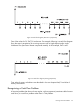
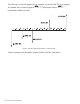
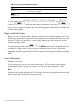
The following is a cash flow diagram for an investment in a mutual fund. This is an example
of a problem that is solved using either \½ (Net Present Value) or \Á
(Internal Rate of Return per Year).
Figure 6 Cash flow diagram (Investment in a mutual fund)
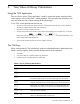
Cash flow problems are described in chapter 8 titled, Cash Flow Calculations.