
User`s guide


Statistical Calculations120
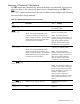
Mean, Standard Deviations, and Summation Statistics
You can calculate the mean ( ), sample standard deviation (S
x
), and population standard
deviation (
x
), and summation statistics, n,
x
, and x
2
of x-data. For x,y data, you can also
calculate the mean, sample standard deviation, and population standard deviation of the y-
data and the summation statistics y, y
2
, and xy.
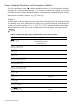
Example 2
A yacht captain wants to determine how long it takes to change a sail. She randomly chooses
six members of her crew, observes them as they carry out the sail change, and records the
numbers of minutes required: 4.5, 4, 2, 3.25, 3.5, 3.75. Calculate the mean and sample
standard deviation of the times. Also, calculate the root mean square, using the formula,
.
Table 12-7 Example calculating mean, standard deviation, and summation statistics
Keys Display Description
\t
STAT CLR
(message flashes briefly,
then disappears)
Clears statistics memory.
Y7V¡
1.00 Enters first time.
Y¡
2.00 Enters second time.
G¡
3.00 Enters third time.
D7GV¡
4.00 Enters fourth time.
D7V¡
5.00 Enters fifth time.
D7jV¡
6.00 Enters sixth time
\k
3.50 Calculates the mean.
\h
0.85 Calculates the sample standard
deviation.
]l
77.13
Displays .
a][
6.00 Displays n.
4\B
3.59 Calculates the root mean
square.
x
σ
Σ
Σ
Σ
Σ
Σ
x
2
n⁄
∑
Σx
2