
User's Manual
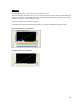
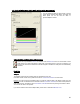

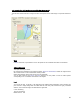
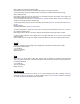
Table Of Contents
- Introduction / Requirements
- Installation
- Login
- Keycode Entry
- Hardware Configuration
- Printers / Queues
- The Configuration Wizard
- Create Queue
- Create Printer Cluster
- Preferences
- Menu Bar Options
- Reprocontrol.client main applications
- Filter Editor
- Functions and Structure of the Filter Editor
- Preview of the Filter Editor
- Histogram
- Tab Black and White Point (Color Mode without Color Management)
- Tab Postprocessing (Black & White Mode)
- Tab Gamma Correction (Color Mode without Color Management)
- Tab Enhancement (Color Mode with Color Management)
- Tab Special Filter (All Modes except of Black & White Mode)
- Tab Color Adjust (Color Mode with Color Management)
- Tab Color Exchange (Color Mode with Color Management)
- Functions and Structure of the Filter Editor
- Reprocontrol.WinDriver
- Reprocontrol.monitor
- Costtracker
- Reprocontrol.backup
61
Histogram
The histogram is shown once you have clicked on the button PREVIEW.
The x-axis represents the spread of each color, or its respective brightness values, while the y-axis displays the
frequency of occurrence of each RGB-value. So the x-axis goes from black to white, with values of low intensity
on the left, and values of higher intensity on the right.
The arrow keys allow you to rescale the histogram.
The check boxes on the left side of the histogram allow you to activate or deactivate the single color bars.
Histogramm without color management
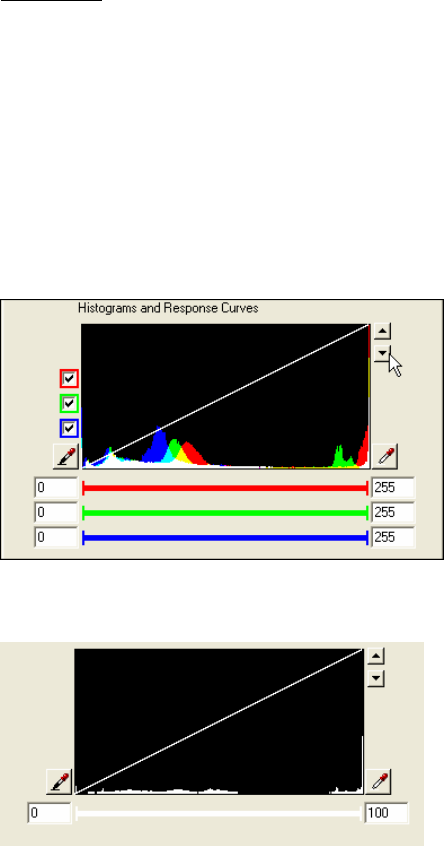
Histogramm with color management