
User's Manual
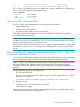
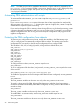
Table Of Contents
- HP Process Resource Manager User Guide
- Contents
- Preface
- 1 Overview
- 2 Understanding how PRM manages resources
- 3 PRM configuration planning
- 4 Setting up PRM
- 5 Using PRM with HP System Management Homepage (SMH)
- 6 Using PRM with HP Systems Insight Manager (SIM)
- 7 Configuring and enabling PRM on the command line
- Quick start to using PRM’s command-line interface
- Configuring PRM
- The PRM configuration file
- Configuration tips and requirements
- Specifying PRM groups/controlling CPU resource use
- Controlling memory use
- Controlling applications
- Specifying PRM users
- Assigning secure compartments to PRM groups
- Assigning Unix groups to PRM groups
- Checking the configuration file
- Loading the PRM configuration
- Enabling resource managers
- Updating the configuration
- 8 Fine-tuning your PRM configuration
- 9 Administering PRM
- Moving processes between PRM groups
- Displaying application filename matches
- Displaying netgroup expansions
- Displaying accessible PRM groups
- Displaying state and configuration information
- Displaying application and configuration information
- Setting the memory manager’s polling interval
- Setting the application manager’s polling interval
- Disabling PRM
- Resetting PRM
- Monitoring PRM groups
- Logging PRM memory messages
- Logging PRM application messages
- Displaying groups’ allocated and used resources
- Displaying user information
- Displaying available memory to determine number of shares
- Displaying number of cores to determine number of shares
- Displaying past process information
- Displaying current process information
- Monitoring PRM with GlancePlus
- Monitoring PRM with OpenView Performance Agent (OVPA) / OpenView Performance Manager (OVPM)
- Automating PRM administration with scripts
- Protecting the PRM configuration from reboots
- Reconstructing a configuration file
- Special case of interest: Client/server connections
- Online cell operations
- Backing up PRM files
- A Command reference
- B HP-UX command/system call support
- C Monitoring PRM through SNMP
- D Creating Secure Resource Partitions
- E Using PRM with Serviceguard
- F Using PRM with HP Integrity Virtual Machines
- G PRM error messages
- Glossary
- Index
decreases if prm2d is running, because PRM reserves 11% of the remaining memory to ensure
the processes in PRM_SYS have immediate access to needed memory.
This command is useful in determining memory shares. For example, if a PRM group receives 50
of the 100 memory shares assigned, the number of shares equates to 106 Mbytes on this system.
If that is too much or too little memory, the number of shares can be adjusted accordingly.
Displaying number of cores to determine number of shares
The prmavail command displays the number of cores when the CPU argument is specified:
# prmavail CPU
16 Cores
This command is useful in determining how much CPU resources a number of shares equates to
on a multiprocessor system. For example, 25 CPU shares out of a total of 100 shares assigned on
a 16-core system is roughly equivalent to 4 cores.
Displaying past process information
The acctcom command with the -P option prints the PRM group name in addition to the customary
acctcom information for all groups on the system. Adding the -R option and a PRM group name
displays information for that group. The following command displays history information about all
PRM groups:
#acctcom -P
COMMAND START END REAL CPU
NAME USER TTYNAME TIME TIME (SECS) (SECS) PRMID
ls root ttyp1 17:32:08 17:32:08 0.02 0.01 OTHERS
rm root ttyp1 17:32:25 17:32:25 0.25 0.02 OTHERS
registra root ? 17:33:04 17:33:04 0.04 0.04 PRM_SYS
vi dev1 ttyp2 17:33:07 17:33:35 28.20 0.05 develop
cpp.ansi dev1 ttyp2 17:33:49 17:33:49 0.04 0.01 develop
ccom dev1 ttyp2 17:33:49 17:33:49 0.16 0.13 develop
ld dev1 ttyp2 17:33:49 17:33:49 0.15 0.12 develop
cc dev1 ttyp2 17:33:49 17:33:49 0.41 0.02 develop
vi dev1 ttyp2 17:34:00 17:34:52 52.57 2.76 develop
hostname root ttyp1 17:35:56 17:35:56 0.01 0.01 OTHERS
ls root ttyp1 17:36:11 17:36:11 0.03 0.03 OTHERS
more root ttyp1 17:36:12 17:36:19 7.00 0.05 OTHERS
The prmanalyze utility is also useful for examining past process data. For syntax information,
see “prmanalyze” on (page 102) . For usage examples, see “Using prmanalyze to quickly
identify resource use” on (page 42) and “Using prmanalyze to analyze your configuration” on
(page 83) .
Displaying current process information
Using the ps command with the -P option adds a column listing each process’s PRM group by
name.
#ps -P
PRMID PID TTY TIME COMMAND
PRM_SYS 1047 ttyp2 0:01 sh
PRM_SYS 1046 ttyp2 0:02 rlogind
PRM_SYS 1081 ttyp2 0:00 ps
OTHERS 548 ? 0:20 sendmail
By using ps with the -l and -P options, the PRMID is printed instead of the PRM group name.
#ps -l -P
F S UID PRMID PID PPID C PRI NI ADDR SZ WCHAN TTY TIME COMD
1 S 0 1 3300 3299 0 158 20 65c180 78 418480 ttyp2 0:00 sh
1 R 0 0 3299 492 0 154 20 6a1d80 18 ttyp2 0:00 rlogind
96 Administering PRM