
User's Manual
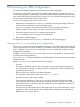
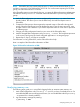
Table Of Contents
- HP Process Resource Manager User Guide
- Contents
- Preface
- 1 Overview
- 2 Understanding how PRM manages resources
- 3 PRM configuration planning
- 4 Setting up PRM
- 5 Using PRM with HP System Management Homepage (SMH)
- 6 Using PRM with HP Systems Insight Manager (SIM)
- 7 Configuring and enabling PRM on the command line
- Quick start to using PRM’s command-line interface
- Configuring PRM
- The PRM configuration file
- Configuration tips and requirements
- Specifying PRM groups/controlling CPU resource use
- Controlling memory use
- Controlling applications
- Specifying PRM users
- Assigning secure compartments to PRM groups
- Assigning Unix groups to PRM groups
- Checking the configuration file
- Loading the PRM configuration
- Enabling resource managers
- Updating the configuration
- 8 Fine-tuning your PRM configuration
- 9 Administering PRM
- Moving processes between PRM groups
- Displaying application filename matches
- Displaying netgroup expansions
- Displaying accessible PRM groups
- Displaying state and configuration information
- Displaying application and configuration information
- Setting the memory manager’s polling interval
- Setting the application manager’s polling interval
- Disabling PRM
- Resetting PRM
- Monitoring PRM groups
- Logging PRM memory messages
- Logging PRM application messages
- Displaying groups’ allocated and used resources
- Displaying user information
- Displaying available memory to determine number of shares
- Displaying number of cores to determine number of shares
- Displaying past process information
- Displaying current process information
- Monitoring PRM with GlancePlus
- Monitoring PRM with OpenView Performance Agent (OVPA) / OpenView Performance Manager (OVPM)
- Automating PRM administration with scripts
- Protecting the PRM configuration from reboots
- Reconstructing a configuration file
- Special case of interest: Client/server connections
- Online cell operations
- Backing up PRM files
- A Command reference
- B HP-UX command/system call support
- C Monitoring PRM through SNMP
- D Creating Secure Resource Partitions
- E Using PRM with Serviceguard
- F Using PRM with HP Integrity Virtual Machines
- G PRM error messages
- Glossary
- Index
NOTE: GlancePlus does not correctly track the PRM ID at the process level for HP-UX 11i v1
and later in versions C.02.65.00 through C.03.25.00. For correct metrics reporting for FSS PRM
groups, use GlancePlus Version C.03.35.00.
Also, GlancePlus returns incorrect data for the PRM_SYS group for PRM configurations with processor
sets defined. Use the prmmonitor command instead of GlancePlus if you are using PSET PRM
groups.
1. Load the PRM configuration you want to analyze with prmconfig -ie APPL if it is not
already loaded. This allows you to view the PRM Group List under the Reports menu in
GlancePlus.
2. Compare the PRM resource shares against the reported usage in GlancePlus during peak
activity. Select the PRM Group List under the Reports menu to see the active processes, users,
and their resource use. Determine if you need to adjust the shares or move users or processes
to different groups.
3. Change your PRM configuration based on your review of the GlancePlus data.
4. Load the changed PRM configuration with prmconfig -ie APPL. This load places processes
in the owners’ initial groups and each configured application in its assigned group.
5. Repeat Step 2, Step 3, and Step 4 as needed.
For information on using GlancePlus, see the GlancePlus online help.
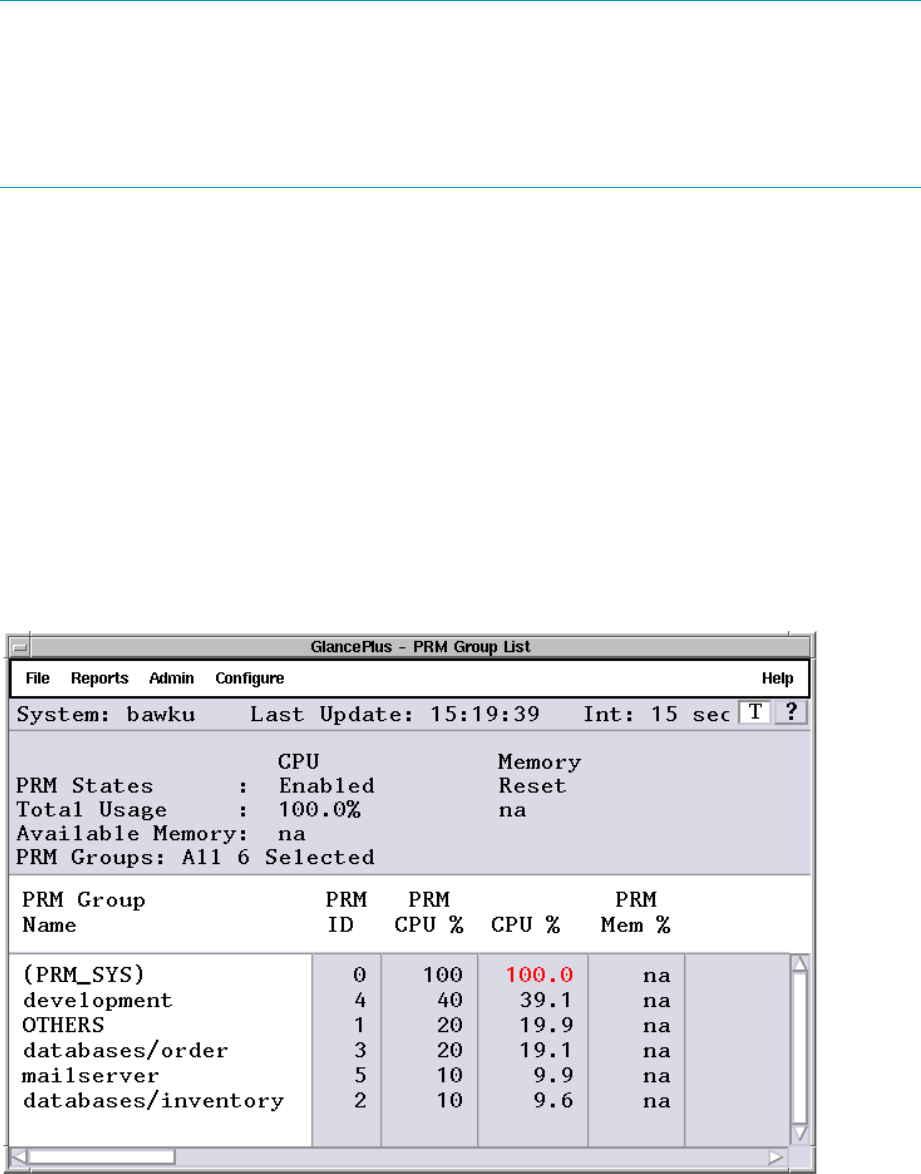
Here is a sample of the GlancePlus information on PRM.
Figure 12 GlancePlus information on PRM
Analyzing memory use
The following steps guide you in using PRM’s logging facility to examine system memory use.
1. Load a PRM configuration with prmconfig -ie APPL if you have not already done so. Do
not enable the PRM resource manager at this time. (You can disable PRM with the prmconfig
-d command if it is already enabled.)
2. Log PRM memory messages by entering:
# prmconfig -L MEM
Analyzing memory use 87