
User's Manual
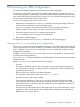
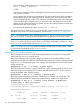
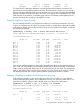
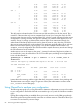
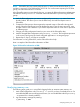
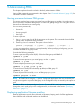
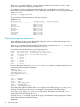
Table Of Contents
- HP Process Resource Manager User Guide
- Contents
- Preface
- 1 Overview
- 2 Understanding how PRM manages resources
- 3 PRM configuration planning
- 4 Setting up PRM
- 5 Using PRM with HP System Management Homepage (SMH)
- 6 Using PRM with HP Systems Insight Manager (SIM)
- 7 Configuring and enabling PRM on the command line
- Quick start to using PRM’s command-line interface
- Configuring PRM
- The PRM configuration file
- Configuration tips and requirements
- Specifying PRM groups/controlling CPU resource use
- Controlling memory use
- Controlling applications
- Specifying PRM users
- Assigning secure compartments to PRM groups
- Assigning Unix groups to PRM groups
- Checking the configuration file
- Loading the PRM configuration
- Enabling resource managers
- Updating the configuration
- 8 Fine-tuning your PRM configuration
- 9 Administering PRM
- Moving processes between PRM groups
- Displaying application filename matches
- Displaying netgroup expansions
- Displaying accessible PRM groups
- Displaying state and configuration information
- Displaying application and configuration information
- Setting the memory manager’s polling interval
- Setting the application manager’s polling interval
- Disabling PRM
- Resetting PRM
- Monitoring PRM groups
- Logging PRM memory messages
- Logging PRM application messages
- Displaying groups’ allocated and used resources
- Displaying user information
- Displaying available memory to determine number of shares
- Displaying number of cores to determine number of shares
- Displaying past process information
- Displaying current process information
- Monitoring PRM with GlancePlus
- Monitoring PRM with OpenView Performance Agent (OVPA) / OpenView Performance Manager (OVPM)
- Automating PRM administration with scripts
- Protecting the PRM configuration from reboots
- Reconstructing a configuration file
- Special case of interest: Client/server connections
- Online cell operations
- Backing up PRM files
- A Command reference
- B HP-UX command/system call support
- C Monitoring PRM through SNMP
- D Creating Secure Resource Partitions
- E Using PRM with Serviceguard
- F Using PRM with HP Integrity Virtual Machines
- G PRM error messages
- Glossary
- Index
3 0.05 0.56 4116.09 23.82
4 0.01 0.14 1226.88 7.11
5 0.03 0.17 2479.65 14.36
Jul 9 0.22 0.87 19008.00
1 0.02 0.60 2208.72 11.62
2 0.09 0.87 7890.23 41.51
3 0.06 0.60 4833.73 25.43
4 0.01 0.15 1699.32 8.94
5 0.02 0.14 2442.53 12.85
Jul 10 0.09 0.88 7996.40
1 0.00 0.10 193.63 2.42
2 0.09 0.88 7348.53 91.89
3 0.00 0.08 180.96 2.26
4 0.00 0.04 198.73 2.48
5 0.00 0.01 74.50 4.15
This daily report indicates that the CPU resources are idle most of the time for this period. This is
normal for a business that only uses its computers from 9am to 5pm. During the week, the CPU
resource usage does not vary by more than about 10%, which is a good indication that the current
configuration is working. However, the report for Saturday, July 10th has what appears to be an
anomaly. Group 2 is taking up almost all the machine! Upon closer examination though, the
administrator finds that the total seconds used is about the same as every other day, but all the
other groups went virtually idle on the weekend. This application might be able to do its job even
faster if we took off the memory cap for group 2 only on the weekends. Because there is no
contention, a second configuration file could be created to repeal all memory records and change
the CPU allocations for the weekend.
Another item to note in the report is that group 1 (OTHERS) has bursts of high activity relative to
its normal levels. It may be worthwhile to do a CPU conflict report, excluding known applications,
to see who the offender is:
#prmanalyze -s command -r cpu -t conflict -1 -d .4 -x mrkt_rsch -x
financials
conflict CPU report by command name begins at Thu Jul 8 10:11:00 1999
ave CPUs threshold 0.40
unique id ave CPUs peak CPUs total secs % total
Jul 8 8:35 -
Jul 8 9:17 0.58 0.80 6102.48
mail_reader 0.50 0.56 5331.36 87.36
java 0.06 0.20 578.52 9.48
vi 0.02 0.09 155.52 2.55
It seems that in the morning, and then again after lunch, everyone in OTHERS is busy reading mail.
The administrator can track this usage. If it gets out of hand, the administrator can then isolate
mail_reader to its own PRM group.
Using GlancePlus to analyze your configuration
The following steps guide you in using GlancePlus to determine adjustments you may wish to make
to your configuration. GlancePlus has both a text interface (glance) and an X-Windows interface
(gpm).
Having PRM configured but not enabled allows you to track resource use by PRM group through
GlancePlus without having PRM actually control the use of these resources. GlancePlus allows you
to monitor CPU and memory resource usage.
86 Fine-tuning your PRM configuration