
User's Manual
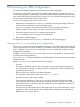
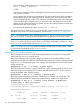
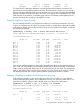
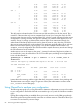
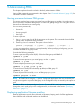
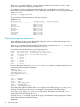
Table Of Contents
- HP Process Resource Manager User Guide
- Contents
- Preface
- 1 Overview
- 2 Understanding how PRM manages resources
- 3 PRM configuration planning
- 4 Setting up PRM
- 5 Using PRM with HP System Management Homepage (SMH)
- 6 Using PRM with HP Systems Insight Manager (SIM)
- 7 Configuring and enabling PRM on the command line
- Quick start to using PRM’s command-line interface
- Configuring PRM
- The PRM configuration file
- Configuration tips and requirements
- Specifying PRM groups/controlling CPU resource use
- Controlling memory use
- Controlling applications
- Specifying PRM users
- Assigning secure compartments to PRM groups
- Assigning Unix groups to PRM groups
- Checking the configuration file
- Loading the PRM configuration
- Enabling resource managers
- Updating the configuration
- 8 Fine-tuning your PRM configuration
- 9 Administering PRM
- Moving processes between PRM groups
- Displaying application filename matches
- Displaying netgroup expansions
- Displaying accessible PRM groups
- Displaying state and configuration information
- Displaying application and configuration information
- Setting the memory manager’s polling interval
- Setting the application manager’s polling interval
- Disabling PRM
- Resetting PRM
- Monitoring PRM groups
- Logging PRM memory messages
- Logging PRM application messages
- Displaying groups’ allocated and used resources
- Displaying user information
- Displaying available memory to determine number of shares
- Displaying number of cores to determine number of shares
- Displaying past process information
- Displaying current process information
- Monitoring PRM with GlancePlus
- Monitoring PRM with OpenView Performance Agent (OVPA) / OpenView Performance Manager (OVPM)
- Automating PRM administration with scripts
- Protecting the PRM configuration from reboots
- Reconstructing a configuration file
- Special case of interest: Client/server connections
- Online cell operations
- Backing up PRM files
- A Command reference
- B HP-UX command/system call support
- C Monitoring PRM through SNMP
- D Creating Secure Resource Partitions
- E Using PRM with Serviceguard
- F Using PRM with HP Integrity Virtual Machines
- G PRM error messages
- Glossary
- Index
java 608.99 1.107E+03 3.654E+04 1.17
debugger 50031.32 1.678E+05 3.002E+06 96.26
This report shows a debugger application consuming almost all the memory in OTHERS. This
prevents other users from getting useful work done. The administrator can use acctcom to find
the user running the debugger. If this user is a developer trying to locate a bug in the sales database
program, change the user record to place him in the Sales group. If he is unrelated to any of the
other activities on the machine, a separate group with low CPU/memory shares (taken from the
OTHERS allocation) and a memory cap might be in order.
Example: High-level views of usage
The next example assumes a new multiprocessor machine in a university environment. One way
to get a very high-level view of usage is to request a weekly or monthly report, setting the threshold
so high that no details come out. Because HP-UX limits accounting files to two Mbytes, several files
may need to be specified:
#prmanalyze -t weekly -d 16 *.acct98 Jan.acct99 Feb.acct99
weekly CPU report by command name begins at Thu Nov 5 13:48:00 1998
ave CPUs threshold 16.0
unique id ave CPUs peak CPUs total secs % total
Nov 1 0.00 0.00 0.00
Nov 8 0.00 0.02 1.61
Nov 15 0.01 1.11 4132.40
Nov 22 0.02 1.08 14136.57
Nov 29 0.02 1.53 9202.16
Dec 6 0.03 1.73 21125.86
Dec 13 0.02 0.75 14656.94
Dec 20 0.00 0.88 739.48
Dec 27 0.00 0.66 1243.89
Jan 3 0.00 0.63 2589.75
Jan 10 0.08 2.05 46000.07
Jan 17 0.09 7.58 53873.11
Jan 24 0.06 7.58 35398.47
Jan 31 0.07 9.34 68588.17
Feb 7 0.09 12.24 119510.85
One can see a definite progression here. Users gradually learn about the new machine and try it
out in 1998, with usage slacking over the holiday break. Then, at the start of the first 1999 semester,
usage increases dramatically. At this rate, all 16 cores will be busy by next week. The administrator
needs to take definite steps to ensure all user groups have a fair portion of the machine. Perhaps
the department should even consider ordering another system for the classes in question.
Example: Checking for patterns and configuration accuracy
In the following example, we assume a single-core system. Every so often, it is a good idea to
examine daily reports for patterns and configuration accuracy. For reports on recent data, it is a
good idea to add the -p flag to catch jobs that never exit or that run for several days:
#prmanalyze -s prmid -r cpu -p -t daily -x 0 filename
daily CPU report by PRM id begins at Thu Jul 8 10:11:00 1999
ave CPUs threshold 0.01
unique id ave CPUs peak CPUs total secs % total
Jul 8 0.20 0.89 17280.72
1 0.02 0.55 1195.84 11.59
2 0.09 0.88 7439.40 43.08
Using prmanalyze to analyze your configuration 85