
User's Manual
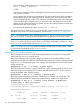
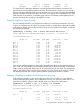
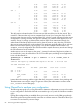
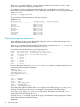
Table Of Contents
- HP Process Resource Manager User Guide
- Contents
- Preface
- 1 Overview
- 2 Understanding how PRM manages resources
- 3 PRM configuration planning
- 4 Setting up PRM
- 5 Using PRM with HP System Management Homepage (SMH)
- 6 Using PRM with HP Systems Insight Manager (SIM)
- 7 Configuring and enabling PRM on the command line
- Quick start to using PRM’s command-line interface
- Configuring PRM
- The PRM configuration file
- Configuration tips and requirements
- Specifying PRM groups/controlling CPU resource use
- Controlling memory use
- Controlling applications
- Specifying PRM users
- Assigning secure compartments to PRM groups
- Assigning Unix groups to PRM groups
- Checking the configuration file
- Loading the PRM configuration
- Enabling resource managers
- Updating the configuration
- 8 Fine-tuning your PRM configuration
- 9 Administering PRM
- Moving processes between PRM groups
- Displaying application filename matches
- Displaying netgroup expansions
- Displaying accessible PRM groups
- Displaying state and configuration information
- Displaying application and configuration information
- Setting the memory manager’s polling interval
- Setting the application manager’s polling interval
- Disabling PRM
- Resetting PRM
- Monitoring PRM groups
- Logging PRM memory messages
- Logging PRM application messages
- Displaying groups’ allocated and used resources
- Displaying user information
- Displaying available memory to determine number of shares
- Displaying number of cores to determine number of shares
- Displaying past process information
- Displaying current process information
- Monitoring PRM with GlancePlus
- Monitoring PRM with OpenView Performance Agent (OVPA) / OpenView Performance Manager (OVPM)
- Automating PRM administration with scripts
- Protecting the PRM configuration from reboots
- Reconstructing a configuration file
- Special case of interest: Client/server connections
- Online cell operations
- Backing up PRM files
- A Command reference
- B HP-UX command/system call support
- C Monitoring PRM through SNMP
- D Creating Secure Resource Partitions
- E Using PRM with Serviceguard
- F Using PRM with HP Integrity Virtual Machines
- G PRM error messages
- Glossary
- Index

The command to generate these reports: [LINEBREAK]prmanalyze -t {hourly |
daily | weekly | monthly}
• Conflict
This report provides the most detail, highlighting only the instances where resources are scarce
and users are in conflict.
Use this report when fine-tuning a configuration. This report catches items that are missed by
the time-based reports. After identifying conflicts, determine how much resource each PRM
group needed during each conflict. Then determine what percentage of the resource the PRM
group actually received. With this data, you can locate users and applications that are not
getting as much of the resource as they should. You can also locate the parties involved most
often and least often in the conflicts.
The command to generate this report: prmanalyze -t conflict
This section focuses on certain prmanalyze functionality. Command options are used, but not
described, in this section. For syntax information, see the section “prmanalyze ” (page 102).
NOTE: The examples below are for illustrative purposes only. They are not from an actual machine.
The “summary report” is omitted from the examples below to better focus on the other reports.
The examples assume you have an existing PRM configuration that you want to improve. The
prmanalyze utility can also be used to create an initial PRM configuration, as shown in “Using
prmanalyze to quickly identify resource use” on (page 42) .
NOTE: To use prmanalyze, you must have already collected UNIX accounting data in a file
(/var/adm/pacct by default) using accton filename.
Example: Locating system bottlenecks
The first example shows how one might locate system bottlenecks and fine-tune a configuration
with the aid of prmanalyze special reports.
Many of the interactive users assigned to the group OTHERS have complained that the system
response time is terrible in the afternoons. The administrator examines the summary reports generated
by prmanalyze, but sees nothing out of the ordinary. The administrator then looks more closely
at CPU resource use:
#prmanalyze -r cpu -1 -t hourly -s prmid myacct
The CPU hourly report, however, is normal. The OTHERS group is getting plenty of CPU resources
at all times. It has shares equaling 25%, but never demands more than 15%. So CPU resources
are not the problem. Next, examine memory:
#prmanalyze -r mem -E -1 -t hourly -s prmid myacct
The memory report does show that OTHERS is peaking out on memory use around 3pm. The
administrator then generates the same memory report, filtering out the known applications:
#prmanalyze -r mem -E -1 -t hourly -x web_browser -x financials
-x mrkt_rsch -x sales_fcst myacct
sorting chronological events
hourly memory report by command name begins at Wed Jul 7 15:27:00 1999
ave KB mem threshold 0.01
unique id ave KB peak KB KB minutes % total
Jul 7 15:00 51976.33 1.725E+05 3.119E+06
mail_reader 1082.25 3.861E+03 6.494E+04 2.08
84 Fine-tuning your PRM configuration