
User's Manual
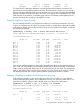
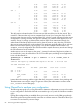
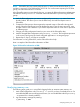
Table Of Contents
- HP Process Resource Manager User Guide
- Contents
- Preface
- 1 Overview
- 2 Understanding how PRM manages resources
- 3 PRM configuration planning
- 4 Setting up PRM
- 5 Using PRM with HP System Management Homepage (SMH)
- 6 Using PRM with HP Systems Insight Manager (SIM)
- 7 Configuring and enabling PRM on the command line
- Quick start to using PRM’s command-line interface
- Configuring PRM
- The PRM configuration file
- Configuration tips and requirements
- Specifying PRM groups/controlling CPU resource use
- Controlling memory use
- Controlling applications
- Specifying PRM users
- Assigning secure compartments to PRM groups
- Assigning Unix groups to PRM groups
- Checking the configuration file
- Loading the PRM configuration
- Enabling resource managers
- Updating the configuration
- 8 Fine-tuning your PRM configuration
- 9 Administering PRM
- Moving processes between PRM groups
- Displaying application filename matches
- Displaying netgroup expansions
- Displaying accessible PRM groups
- Displaying state and configuration information
- Displaying application and configuration information
- Setting the memory manager’s polling interval
- Setting the application manager’s polling interval
- Disabling PRM
- Resetting PRM
- Monitoring PRM groups
- Logging PRM memory messages
- Logging PRM application messages
- Displaying groups’ allocated and used resources
- Displaying user information
- Displaying available memory to determine number of shares
- Displaying number of cores to determine number of shares
- Displaying past process information
- Displaying current process information
- Monitoring PRM with GlancePlus
- Monitoring PRM with OpenView Performance Agent (OVPA) / OpenView Performance Manager (OVPM)
- Automating PRM administration with scripts
- Protecting the PRM configuration from reboots
- Reconstructing a configuration file
- Special case of interest: Client/server connections
- Online cell operations
- Backing up PRM files
- A Command reference
- B HP-UX command/system call support
- C Monitoring PRM through SNMP
- D Creating Secure Resource Partitions
- E Using PRM with Serviceguard
- F Using PRM with HP Integrity Virtual Machines
- G PRM error messages
- Glossary
- Index

8 Fine-tuning your PRM configuration
This chapter describes the optional step of fine-tuning your PRM configuration.
To adjust your configuration, you may need to perform several iterations of identifying resource
use and assigning groups. Fundamentally, you need to understand what processes are run by what
users and the percentages of resources they consume. How you collect this data depends on how
your processes or system load varies from day to day.
You can use the following tools to track resource use:
• PRM monitor (accessed by the prmmonitor command) shows the percentage of CPU and
memory resources allocated to and used by PRM groups.
• prmanalyze analyzes accounting files for data on resource usage and contention.
• PerfView Analyzer analyzes how your system resources are used over time.
• GlancePlus pinpoints resource use in real-time and sets alarms.
• acctcom displays process accounting record information.
• PRM memory message logging.
This chapter discusses the use of prmanalyze, GlancePlus, and message logging.
Using prmanalyze to analyze your configuration
The prmanalyze utility scans accounting files for information on the desired resource type (memory
or CPU) and orders the accounting records by the requested sort key (user, UNIX group, command
name, or PRMID). Use prmanalyze to find patterns in resource usage, then change your PRM
configurations accordingly.
In addition, you can use prmanalyze—even when you are not using PRM—to perform resource
use analysis and capacity planning.
Use prmanalyze -f to list which features are available to PRM, such as in-kernel memory controls
and processor sets.
With prmanalyze, you can generate three classes of reports:
• Summary
This report is the default. It shows who consumes the resources and what the averages are
from a high level. It can help you identify what user or applications need to be restrained or
guaranteed more resources.
Use this report when creating a new PRM configuration.
The command to generate this report: prmanalyze -t summary
• Time-based (hourly, daily, weekly, monthly)
These reports provide data on resource use over a given time period for all the available
accounting data. These reports can help you determine what part of the day (hour, week, or
month) each resource is most used. They also identify the users and applications involved in
the resource consumption.
Use these reports when enhancing an initial configuration to give special attention to users or
applications. Also use these reports when creating multiple configurations to implement at
different times over a given interval.
Using prmanalyze to analyze your configuration 83