
User's Manual
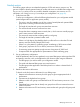
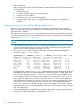
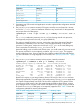

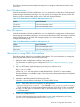
Table Of Contents
- HP Process Resource Manager User Guide
- Contents
- Preface
- 1 Overview
- 2 Understanding how PRM manages resources
- 3 PRM configuration planning
- 4 Setting up PRM
- 5 Using PRM with HP System Management Homepage (SMH)
- 6 Using PRM with HP Systems Insight Manager (SIM)
- 7 Configuring and enabling PRM on the command line
- Quick start to using PRM’s command-line interface
- Configuring PRM
- The PRM configuration file
- Configuration tips and requirements
- Specifying PRM groups/controlling CPU resource use
- Controlling memory use
- Controlling applications
- Specifying PRM users
- Assigning secure compartments to PRM groups
- Assigning Unix groups to PRM groups
- Checking the configuration file
- Loading the PRM configuration
- Enabling resource managers
- Updating the configuration
- 8 Fine-tuning your PRM configuration
- 9 Administering PRM
- Moving processes between PRM groups
- Displaying application filename matches
- Displaying netgroup expansions
- Displaying accessible PRM groups
- Displaying state and configuration information
- Displaying application and configuration information
- Setting the memory manager’s polling interval
- Setting the application manager’s polling interval
- Disabling PRM
- Resetting PRM
- Monitoring PRM groups
- Logging PRM memory messages
- Logging PRM application messages
- Displaying groups’ allocated and used resources
- Displaying user information
- Displaying available memory to determine number of shares
- Displaying number of cores to determine number of shares
- Displaying past process information
- Displaying current process information
- Monitoring PRM with GlancePlus
- Monitoring PRM with OpenView Performance Agent (OVPA) / OpenView Performance Manager (OVPM)
- Automating PRM administration with scripts
- Protecting the PRM configuration from reboots
- Reconstructing a configuration file
- Special case of interest: Client/server connections
- Online cell operations
- Backing up PRM files
- A Command reference
- B HP-UX command/system call support
- C Monitoring PRM through SNMP
- D Creating Secure Resource Partitions
- E Using PRM with Serviceguard
- F Using PRM with HP Integrity Virtual Machines
- G PRM error messages
- Glossary
- Index

Table 10 Initial configuration based on prmanalyze’s CPU report
CPU sharesPRM groupApplication
35Researchmrkt_rsch
20Financefinancials
5Webweb_browser
15Salessales_fcst
25OTHERSAll other applications
3. Generate group/CPU records and application records to implement the configuration decided
upon in Step 2.
4. Use prmanalyze to create a summary CPU report, sorted by user and piped to a reverse
sort on the “% total” column to determine if there are any critical users on the system that
may require their own PRM groups:
#prmanalyze -s uid -r cpu -x root -p -t summary -1filename| sort -r
+5
The -x root combination prevents prmanalyze from showing data for root processes,
which typically are placed in the PRM_SYS group (PRMID 0).
The output is omitted for brevity. However, assume the output shows that most of the sales
forecast data is entered by one or two users, consuming approximately 3% of the CPU
resources. For these users, create user records with sales_fcst as the initial PRM group.
Then increase the CPU shares for sales_fcst from 15 to 18.
Instead of adding a user record for each of these users, you could create only one user record.
This record would be for a new netgroup you define, say finance_dept. The netgroup
would include these users. Using a netgroup also simplifies updates when the staff changes.
For more information on using netgroups in user records, see “Specifying PRM users ” (page
71).
5. Use prmanalyze to create a summary memory report, sorted by command:
#prmanalyze -s command -r mem -p -t summary -1filename
summary memory report by command name : 2231 records processed
unique id processes ave KB peak KB KB minutes % total
mrkt_rsch 804 270.83 3132517.22 4273171.32 1.17
financials 759 4356.04 389279.46 107851933.76 29.53
f90com32 843 11921.09 16621.58 5003627.94 1.37
web_browser 98 8832.73 1076302.48 4930582.36 1.35
emacs 12 7.13 5009.34 3980988.79 1.09
vi 1743 7.00 7123.54 3688806.00 1.01
sales_fcst 779 349.81 1933.62 62490565.66 17.11
Based on this report, we can assign memory shares of 30 and 2 to the Finance and Web
PRM groups respectively. The peak usage is also worth noticing. The web_browser application
has a peak of approximately one Gbyte. This should be capped at 25% to prevent it from
consuming too much memory. Also, the research program peaks at three Gbytes, causing
poor response time for everyone. With a total of 4 Gbytes on the system, its group needs to
be limited. The Research PRM group is consequently capped at 50%. Table 11 shows the
configuration updated for memory management.
Table 11 Initial configuration based on prmanalyze’s memory report
Memory capMemory sharesCPU sharesPRM groupApplication
50%1035Researchmrkt_rsch
3020Financefinancials
Using prmanalyze to quickly identify resource use 43