
User's Manual
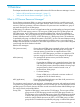
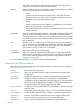
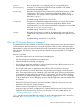
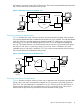
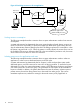
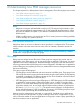
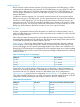
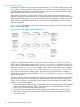
Table Of Contents
- HP Process Resource Manager User Guide
- Contents
- Preface
- 1 Overview
- 2 Understanding how PRM manages resources
- 3 PRM configuration planning
- 4 Setting up PRM
- 5 Using PRM with HP System Management Homepage (SMH)
- 6 Using PRM with HP Systems Insight Manager (SIM)
- 7 Configuring and enabling PRM on the command line
- Quick start to using PRM’s command-line interface
- Configuring PRM
- The PRM configuration file
- Configuration tips and requirements
- Specifying PRM groups/controlling CPU resource use
- Controlling memory use
- Controlling applications
- Specifying PRM users
- Assigning secure compartments to PRM groups
- Assigning Unix groups to PRM groups
- Checking the configuration file
- Loading the PRM configuration
- Enabling resource managers
- Updating the configuration
- 8 Fine-tuning your PRM configuration
- 9 Administering PRM
- Moving processes between PRM groups
- Displaying application filename matches
- Displaying netgroup expansions
- Displaying accessible PRM groups
- Displaying state and configuration information
- Displaying application and configuration information
- Setting the memory manager’s polling interval
- Setting the application manager’s polling interval
- Disabling PRM
- Resetting PRM
- Monitoring PRM groups
- Logging PRM memory messages
- Logging PRM application messages
- Displaying groups’ allocated and used resources
- Displaying user information
- Displaying available memory to determine number of shares
- Displaying number of cores to determine number of shares
- Displaying past process information
- Displaying current process information
- Monitoring PRM with GlancePlus
- Monitoring PRM with OpenView Performance Agent (OVPA) / OpenView Performance Manager (OVPM)
- Automating PRM administration with scripts
- Protecting the PRM configuration from reboots
- Reconstructing a configuration file
- Special case of interest: Client/server connections
- Online cell operations
- Backing up PRM files
- A Command reference
- B HP-UX command/system call support
- C Monitoring PRM through SNMP
- D Creating Secure Resource Partitions
- E Using PRM with Serviceguard
- F Using PRM with HP Integrity Virtual Machines
- G PRM error messages
- Glossary
- Index
of Customer1’s processes receive 25% of the resource. This scenario assumes that the three processes
fully consume the resource allocated to their groups.
Figure 2 Balancing resource use between users
GroupA
Customer1
Customer2
Process1
Process2
Process3
HP-UX server
50%
25%25%
GroupB
Prioritizing resource use between users
Figure 3 illustrates how users’ access to resources can be prioritized using PRM. In this example,
two university departments both contributed to the purchase of a new computer. The math department
paid 25% of the cost, and the engineering department paid 75%. PRM groups are assigned
accordingly: 25% for the math PRM group MGroup and 75% for the engineering PRM group
EGroup. This implies that EGroup processes have priority over MGroup processes. Each group
has only one user: User1 is in MGroup; User2 is in EGroup. User1 is entitled to 25% of the
available resource, and User2 is entitled to 75%. This scenario assumes that the three processes
fully consume the resource allocated to their groups.
Figure 3 Prioritizing resource use between users
MGroup
User2
Process1
Process2
Process3
HP-UX server
75%
25%
EGroup
User1
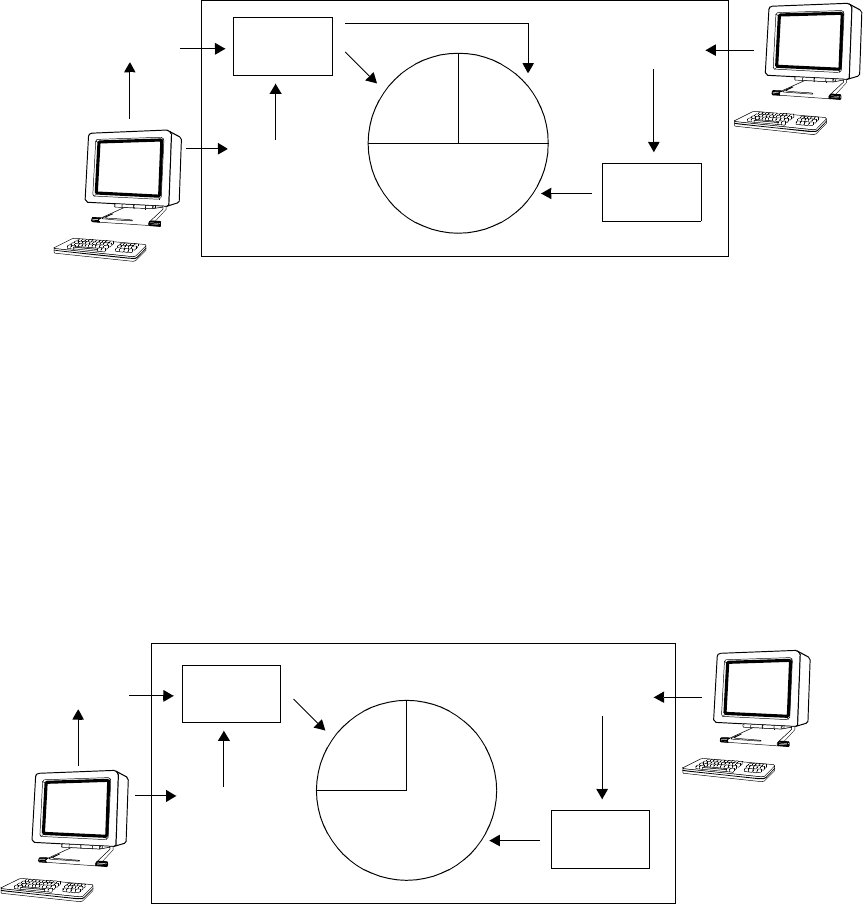
Prioritizing resource use for applications
Figure 4 illustrates a situation where two users and an application are assigned to separate PRM
groups. User1 and User2 are respectively assigned to GroupA and GroupB. Both groups are
given 25%. The critical application is assigned to GroupC, which is given 50%. Because of its
greater resource allocation, GroupC takes priority over GroupA and GroupB. This scenario
assumes that the processes fully consume the resource allocated to their groups.
Why use HP Process Resource Manager? 15