
User's Manual

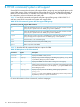
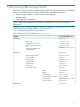
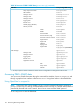
Table Of Contents
- HP Process Resource Manager User Guide
- Contents
- Preface
- 1 Overview
- 2 Understanding how PRM manages resources
- 3 PRM configuration planning
- 4 Setting up PRM
- 5 Using PRM with HP System Management Homepage (SMH)
- 6 Using PRM with HP Systems Insight Manager (SIM)
- 7 Configuring and enabling PRM on the command line
- Quick start to using PRM’s command-line interface
- Configuring PRM
- The PRM configuration file
- Configuration tips and requirements
- Specifying PRM groups/controlling CPU resource use
- Controlling memory use
- Controlling applications
- Specifying PRM users
- Assigning secure compartments to PRM groups
- Assigning Unix groups to PRM groups
- Checking the configuration file
- Loading the PRM configuration
- Enabling resource managers
- Updating the configuration
- 8 Fine-tuning your PRM configuration
- 9 Administering PRM
- Moving processes between PRM groups
- Displaying application filename matches
- Displaying netgroup expansions
- Displaying accessible PRM groups
- Displaying state and configuration information
- Displaying application and configuration information
- Setting the memory manager’s polling interval
- Setting the application manager’s polling interval
- Disabling PRM
- Resetting PRM
- Monitoring PRM groups
- Logging PRM memory messages
- Logging PRM application messages
- Displaying groups’ allocated and used resources
- Displaying user information
- Displaying available memory to determine number of shares
- Displaying number of cores to determine number of shares
- Displaying past process information
- Displaying current process information
- Monitoring PRM with GlancePlus
- Monitoring PRM with OpenView Performance Agent (OVPA) / OpenView Performance Manager (OVPM)
- Automating PRM administration with scripts
- Protecting the PRM configuration from reboots
- Reconstructing a configuration file
- Special case of interest: Client/server connections
- Online cell operations
- Backing up PRM files
- A Command reference
- B HP-UX command/system call support
- C Monitoring PRM through SNMP
- D Creating Secure Resource Partitions
- E Using PRM with Serviceguard
- F Using PRM with HP Integrity Virtual Machines
- G PRM error messages
- Glossary
- Index

prmmonitor -V
prmmonitor [resource| STOPPED] [-h] [-w] [-t] [-s] [interval[iterations]]
Availability: Any user can run the prmmonitor command.
The prmmonitor command displays statistics calculated over specified intervals. Use this command
to show the percentage of CPU and memory allocated to, and used by, PRM groups. By default,
prmmonitor prints one iteration of CPU and memory resource information after a one-second
wait. It also lists the name and timestamp of the configuration file.
Table 24 shows the available options.
Table 24 prmmonitor user options/parameters
DescriptionOption/parameter
Displays allocation and actual use of CPU and memory resources by PRM group.No options
Displays version information and exits.-V
Specifies the resource for which statistics are displayed. Valid resource keywords are:
• CPU
• MEM
• MRG
(providing additional memory resource information for kernels with in-kernel memory controls)
• /dev/vxxx
(where xxx completes the name of a valid logical volume group or disk group)
If a resource is not specified, statistics are displayed for CPU and memory resources.
resource
Displays ps-like output for all processes stopped by the memory manager.STOPPED
Includes parent hierarchical groups in output. )-h
Prints the PRM group names in wide-column format, exceeding the 30-column default if necessary
to avoid clipping any names.
-w
Lists the statistics without table headers.-t
Starts output at PRMID 0 instead of 1.-s
Specifies the length in seconds of the sample interval. The HP-UX memory manager typically
samples memory data every 10 seconds, so if you specify an interval value less than 10
seconds, the same memory statistics may be repeated in sequential displays.
interval
Specifies the number of samples to take; if iterations is not specified, prmmonitor
continues until terminated with a CTRL-C.
iterations
Differences in output from prmmonitor and top
The prmmonitor output shows the MRG for a process, while the top output shows the PRM group
for the process. Typically, the MRG and PRM group for a process match. However, the values may
differ temporarily when a process is first moved to a new PRM group.
prmmove
Syntax:
prmmove -V
prmmove [-w]
prmmove [targetgrp| -i ][-pPID... ][-gpgid... ] [-u login ... ]
Availability: Any user can run the prmmove command.
The prmmove command lets you dynamically move one or more processes between PRM groups.
It also lists the process groups you can access.
prmmove 111