
User's Manual

2. Narrow down the observed issue to the specific troubleshooting procedure required. Isolate
the failure to a specific part of the server blade to perform more detailed troubleshooting. For
example:
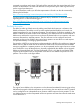
• Issue - Front Panel LED blinking
NOTE: The front panel health LED flashes amber with a warning indication, or flashes
red with a fault indication.
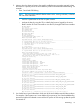
◦ Look for a system alert on the OA or system console.
◦ Analyze the alert by using the SEL, to identify the last error logged by the server
blade. Use the iLO 3 MP commands to view the SEL, through the MP menu interface.
MP MAIN MENU:
CO: Console
VFP: Virtual Front Panel
CM: Command Menu
CL: Console Log
SL: Show Event Logs
HE: Main Help Menu
DB: Debug Shell
X: Exit Connection
[ilo3cd92b2fca24] MFG! hpiLO-> sl
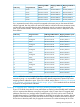
Event Log Viewer Menu:
Log Name Entries % Full Latest Timestamped Entry
-------------------------------------------------------------------------------
E - System Event 489 18 % 03 Jan 2001 00:11:17
F - Forward Progress 13251 68 % 03 Jan 2001 00:11:17
I - iLO Event 136 27 % 03 Jan 2001 03:30:04
C - Clear All Logs
L - Live Events
Enter menu item or [Ctrl-B] to Quit: e
Log Name Entries % Full Latest Timestamped Entry
-------------------------------------------------------------------------------
E - System Event 489 18 % 03 Jan 2001 00:11:17
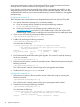
Event Log Navigation Help:
+ View next block (forward in time, e.g. from 3 to 4)
- View previous block (backward in time, e.g. from 3 to 2)
<CR> Continue to the next or previous block
D Dump the entire log
F First entry
L Last entry
J Jump to entry number
H View mode configuration - Hex
K View mode configuration - Keyword
T View mode configuration - Text
S View mode configuration - Cause/Action
A Alert Level Filter options
U Alert Level Unfiltered
? Display this Help menu
Q Quit and return to the Event Log Viewer Menu
Ctrl-B Exit command, and return to the MP Main Menu
# Location |Alert | Encoded Field | Data Field | Keyword/Timestamp
-------------------------------------------------------------------------------
480 SFW 1,0,2,0 *7 F480003709E1039B 000000000000000F BOOT_HALT_CELL
02 Jan 2001 22:29:12
479 SFW 1,0,2,0 *7 E48000D109E10399 FFFFFF01FFFFFF94 MEM_NO_MEM_FOUND
02 Jan 2001 22:29:12
478 SFW 1,0,2,0 2 40801FB109E10397 0000000000000000 MEM_NON_OPTIMAL_CONFIG
02 Jan 2001 22:29:12
477 SFW 1,0,2,0 *5 BA801F9D09E10395 FFFFFF0100100B74 MEM_DIMM_INFO_HW_DEALLOCATED
02 Jan 2001 22:29:11
476 SFW 1,0,2,0 *5 BA801F9D09E10393 FFFFFF0100090B74 MEM_DIMM_INFO_HW_DEALLOCATED
02 Jan 2001 22:29:11
475 SFW 1,0,2,0 *3 688024FE09E10391 000000000100000F MEM_DDR_TRN_ERR
02 Jan 2001 22:29:11
474 SFW 1,0,2,0 *3 688024FE09E1038F 0000000001010100 MEM_DDR_TRN_ERR
02 Jan 2001 22:29:11
MFG! SL:hpiLO (+,-,<CR>CR>,D,F,L,J,H,K,T,S,A,U,?,Q or Ctrl-B to Quit)->
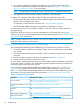
3. You should have a good idea about which area of the server blade requires further analysis.
For example, if the symptom was “server blade will not power-up”, the initial troubleshooting
procedure might have indicated a issue with the DC power rail not coming up after the power
was turned on.
Methodology 79