
Software User guide
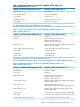


List System Utilization for a Process
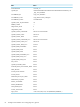
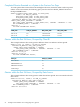
This query retrieves information about system utilization for a particular process (or set of
processes). Usually, the process in question is a particular NDCS server (that is. an ODBC session).
The result set represents CPU utilization for that server and for its child executor processes.
Results are aggregated for 5 minute intervals. The results are ordered in chronological order. In
this example, an ODBC session that executed a single query saturated the system from
approximately 19:25:00 to 19:35:00 and then was inactive.
NOTE: This query will return data only if the optional process collectors are turned on.
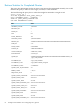
reset param
set param ?segment_id 1;
set param ?node_id 0;
set param ?pin 863;
show param;
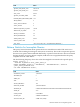
select
segment_id,
node_id,
pin,
sample_date, sample_time
metric_type,
child_count,
child_system_busy_pct as sys_busy
from NEO.HP_METRICS.PROCESS_AGGR_LEVEL1_STATS_V1
where segment_id = ?segment_id
and node_id = ?node_id
and pin = ?pin
order by segment_id, node_id, pin, metric_type, sample_date, sample_time FOR READ UNCOMMITTED ACCESS;
SYS_BUSYCHILD_COUNTMETRIC_TYPESAMPLE_TIMESAMPLE_DATEPINNODE_IDSEGMENT_ID
99.1319MXESP06:30:00.0000002007–05–2986301
99.4719MXESP06:35:00.0000002007–05–2986301
35.9919MXESP06:50:00.0000002007–05–2986301
0.0019MXESP06:35:00.0000002007–05–2986301
0.0019MXESP07:00:00.0000002007–05–2986301
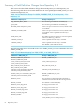
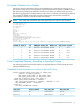
Count Completed Queries, According to Specified Criteria
The following queries all return the number of completed queries, but they break down the
number in different ways.
Completed Queries Executed on a System in the Last 24 Hours
SELECT DISTINCT(QUERY_START_DATE) AS START_DATE,
COUNT(*) AS NUM_OF_QUERIES,
MAX(QUERY_START_TIME) AS MAX_START_TIME,
MIN(QUERY_START_TIME) AS MIN_START_TIME
FROM NEO.HP_METRICS.ODBC_QUERY_STATS_V2
WHERE QUERY_START_DATETIME <= CURRENT
AND QUERY_START_DATETIME >= CURRENT - INTERVAL '1' DAY
AND STATEMENT_STATE = 'COMPLETE'
GROUP BY 1
FOR READ UNCOMMITTED ACCESS;
MIN_START_TIMEMAX_START_TIMENUM_OF_QUERIESSTART_DATE
08:51:0112:48:46.8797742432007–05–23
13:15:1418:44:05.390777492007–05–22
List System Utilization for a Process 69