HP Neoview Repository User Guide HP Part Number: 546262-001 Published: April 2009 Edition: HP Neoview Release 2.
© Copyright 2009 Hewlett-Packard Development Company, L.P. Legal Notice Confidential computer software. Valid license from HP required for possession, use or copying. Consistent with FAR 12.211 and 12.212, Commercial Computer Software, Computer Software Documentation, and Technical Data for Commercial Items are licensed to the U.S. Government under vendor’s standard commercial license. The information contained herein is subject to change without notice.
Table of Contents About This Document.........................................................................................................7 Supported Release Version Updates (RVUs)..........................................................................................7 Intended Audience.................................................................................................................................7 New and Changed Information in This Edition.............................................
Get the Number of Rows in a View......................................................................................................65 Retrieve a Specified Number of Rows from a View.............................................................................65 Retrieve Statistics for Completed Queries............................................................................................66 Retrieve Statistics for Incomplete Queries......................................................................
List of Figures 1-1 Neoview Repository and Related Products..................................................................................
List of Tables 3-1 3-2 3-3 3-4 3-5 3-6 3-7 3-8 3-9 3-10 3-11 3-12 3-13 3-14 3-15 3-16 3-17 6 Comparison of ODBC Query Statistics and Query Runtime Statistics.........................................21 ODBC_QUERY_STATS_V1 Field Definitions...............................................................................22 ODBC_QUERY_STATS_V2 Fields.................................................................................................26 QUERY_RUNTIME_STATS_V1 Field Definitions........................
About This Document This document describes the views supported by the Neoview Manageability Repository, a Neoview SQL database and set of programs that collect and store statistics and other information about queries, query sessions, tables, disks, processing nodes, and (optionally) selected processes involved in query execution on a Neoview platform. Supported Release Version Updates (RVUs) This manual supports N02.04 and subsequent N-series RVUs until otherwise indicated in a replacement publication.
• • Enhancements to Repository status queries to incorporate new features, such as support for Table metrics. New prepackaged queries, and changes in existing queries, to reflect new Repository features and field naming changes. Document Organization This document is organized as follows: Chapter 1: Introduction Use this chapter to learn about the Repository and related Neoview software products.
DATETIME [start-field TO] end-field A group of items enclosed in brackets is a list from which you can choose one item or none. The items in the list can be arranged either vertically, with aligned brackets on each side of the list, or horizontally, enclosed in a pair of brackets and separated by vertical lines. For example: DROP SCHEMA schema [CASCADE] [RESTRICT] DROP SCHEMA schema [ CASCADE | RESTRICT ] { } Braces Braces enclose required syntax items. For example: FROM { grantee[, grantee]...
Item Spacing Spaces shown between items are required unless one of the items is a punctuation symbol such as a parenthesis or a comma. For example: DAY (datetime-expression) DAY(datetime-expression) If there is no space between two items, spaces are not permitted. In this example, no spaces are permitted between the period and any other items: myfile.
Neoview Command Interface (NCI) Online Help Command-line help that describes the commands supported in the current operating mode of Neoview Command Interface. Neoview DB Admin Online Help Context-sensitive help topics that describe how to use the HP Neoview DB Admin management interface.
Publishing History Part Number Product Version Publication Date NA Release 2.0 February 2007 NA Release 2.1 May 2007 544570–001 Release 2.2 August 2007 544811–001 Release 2.3 April 2008 546262-001 Release 2.4 April 2009 HP Encourages Your Comments HP encourages your comments concerning this document. We are committed to providing documentation that meets your needs. Send any errors found, suggestions for improvement, or compliments to docsfeedback@hp.com.
1 Introduction Repository Features and Interfaces The Neoview Manageability Repository is a Neoview SQL database and set of programs that automatically collect and store statistics and other information about the following entities on a Neoview platform: • • • • • • Queries initiated through ODBC and JDBC. Certain data about queries is available from the time the query starts; other data becomes available only after the query is complete. Queries managed by Workload Management Services (WMS).
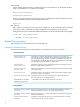
components and present some similar information but are typically used for slightly different purposes: • • You use the Dashboard client to monitor queries and system resources on the Neoview platform and to reveal, as soon as possible, if some aspect of system performance is outside an acceptable range. The Dashboard client is a graphical user interface (GUI) that displays current and recent data on color-coded graphs and accompanying grids.
Figure 1-1 Neoview Repository and Related Products Repository Features and Interfaces 15
2 Getting Started with Repository Installation The Repository is initially installed on the Neoview platform by HP Manufacturing. Repository upgrades are installed by HP Support in the context of Neoview platform upgrades. If an earlier version of the Repository software is installed on the platform, the script removes the existing Repository program files, then installs and starts the Repository 2.4 processes. The upgrade from Release 2.3 to Release 2.4 archives the existing data on the platform.
Starting the Repository During installation, the Repository is configured to come up automatically when the Neoview platform starts. By default, statistics are collected for queries (ODBC query statistics and query runtime statistics), connectivity sessions, disks, and processing nodes. Table data may not be available, depending on Dashboard. NOTE: For support of query runtime statistics, Neoview Workload Management Services (WMS) must also be running. It is installed and started by default.
Repository Metric Retention Time Table statistics 30 days Disk statistics 30 days To modify these retention times, contact your HP Support representative.
3 Repository Views Overview You can use the following views for access to the Repository: • • • • • • • • • • “VIEW NEO.HP_METRICS.ODBC_QUERY_STATS_V1” (page 22) “VIEW NEO.HP_METRICS.ODBC_QUERY_STATS_V2” (page 26) “VIEW NEO.HP_METRICS.QUERY_RUNTIME_STATS_V1” (page 29) “VIEW NEO.HP_METRICS.ODBC_SESSION_STATS_V1” (page 37) “VIEW NEO.HP_METRICS.ODBC_SESSION_STATS_V2” (page 40) “VIEW NEO.HP_METRICS.NODE_STATS_V1” (page 43) “VIEW NEO.HP_METRICS.PROCESS_STATS_V1” (page 46) “VIEW NEO.HP_METRICS.
Table 3-1 Comparison of ODBC Query Statistics and Query Runtime Statistics (continued) ODBC Query Statistics Query Runtime Statistics Data source name is available. Service name is available. Data is available for all queries, whether unique or non-unique. Data is available only for queries monitored by WMS. (WMS monitors only NON_UNIQUE queries.) Not synchronized with query data in Neoview Management Dashboard. Synchronized with QueryRTS entity in Neoview Management Dashboard. VIEW NEO.HP_METRICS.
Table 3-2 ODBC_QUERY_STATS_V1 Field Definitions (continued) Field Name Data Type Description SESSION_ID CHARACTER(108) or NCHAR(108) Unique session ID generated by the NDCS server when the ODBC/JDBC connection was established. SEQUENCE_NUM SMALLINT UNSIGNED Message sequence number generated by NDCS. Numbering starts at 0 and is incremented by 1 for each new record. METRIC_CLASS_ID INTEGER UNSIGNED Repository assigned value. Used internally.
Table 3-2 ODBC_QUERY_STATS_V1 Field Definitions (continued) 24 Field Name Data Type Description ERROR_CODE CHARACTER(6) or NCHAR(6) Prepare error code. A value of 0 indicates that the prepare was successful. DATASOURCE CHARACTER(128) or NCHAR(128) Client data source name used at the time of the connection. APPLICATION_ID CHARACTER(130) or NCHAR(128) Client application name or main window caption. CLIENT_ID CHARACTER(15) or NCHAR(15) Client workstation TCP/IP or NetBios/network name.
Table 3-2 ODBC_QUERY_STATS_V1 Field Definitions (continued) Field Name Data Type Description STATEMENT_TYPE CHARACTER(36) or NCHAR(36) Compiler-provided value, one of: SQL_SELECT_UNIQUE, SQL_SELECT_NON_UNIQUE SQL_INSERT_UNIQUE, SQL_INSERT_NON_UNIQUE, SQL_UPDATE_UNIQUE, SQL_UPDATE_NON_UNIQUE, SQL_DELETE_UNIQUE, SQL_DELETE_NON_UNIQUE, SQL_CONTROL, SQL_SET_TRANSACTION, SQL_SET_CATALOG, SQL_SET_SCHEMA, SQL_OTHER, SQL_UNKNOWN, SQL_CALL_NO_RESULT_SETS, SQL_CALL_WITH_RESULT_SETS, SQL_SP_RESULT_SET, SQL_NOT_SUP
node processing node (CPU) number 2 digits pin process identification number 4 digits processStartTS time when the Master Executor process started 18 digits sessionNum sequentially increasing session number 10 digits unLen length of the user ALIAS name 2 digits userName internal safeguard alias for actual user name (see Note following this table) unLen bytes, maximum 32 snLen length of application-specified session 2 digits name sessionName actual session name snLen bytes, maximum 24
Table 3-3 ODBC_QUERY_STATS_V2 Fields (continued) Complete Queries Incomplete Queries Data Type Source and Notes PIN PIN INT UNSIGNED Derived from CPU, PIN SMALLINT UNSIGNED START START_PRIORITY PROCESS_NAME PROCESS_NAME CHAR(18) or NCHAR(18) START SESSION_ID SESSION_ID CHAR(108) or NCHAR(108) START USER_ID USER_ID CHAR(8) or NCHAR(8) START USER_NAME USER_NAME CHAR(20) or NCHAR(20) START CLIENT_ID CLIENT_ID CHAR(15) or NCHAR(15) START APPLICATION_ID APPLICATION_ID CHAR(130) or
Table 3-3 ODBC_QUERY_STATS_V2 Fields (continued) 28 Complete Queries Incomplete Queries Data Type Source and Notes QUERY_START_TIME_UTC QUERY_START_TIME_UTC TIME START QUERY_END_DATETIME QUERY_START_DATETIME TIMESTAMP END, or NULL for an incomplete query QUERY_END_DATE QUERY_START_DATE DATE END, or NULL for an incomplete query QUERY_END_TIME QUERY_START_TIME TIME END, or NULL for an incomplete query QUERY_END_DATETIME_UTC QUERY_START_DATETIME_UTC TIMESTAMP END, or NULL for an incompl
NOTE: In both ODBC_QUERY_STATS_V1 and ODBC_QUERY_STATS_V2, the QUERY_ID field contains the unique ID of the query unless an error occurs before the query is launched. In this case, no query ID is assigned, and the corresponding field is populated with the value . The rest of the information pertaining to the query, including the error code, is stored in the appropriate columns. VIEW NEO.HP_METRICS.QUERY_RUNTIME_STATS_V1 This view provides information collected while a query is running.
Table 3-4 QUERY_RUNTIME_STATS_V1 Field Definitions (continued) Field Name (* means available only in this view) Data Type 30 Description NODE_ID SMALLINT UNSIGNED NO DEFAULT Processing node number of the NDCS server which reported the statistics. This is the node where the master executor process which executed the query was running. PIN SMALLINT UNSIGNED NO DEFAULT Process identification number of the NDCS server which reported the statistics.
Table 3-4 QUERY_RUNTIME_STATS_V1 Field Definitions (continued) Field Name (* means available only in this view) Data Type Description LAG_ELAPSED_TIME* INTERVAL MINUTE(6) NO DEFAULT Difference in minutes between the time when WMS last refreshed statistics from RMS. (REFRESH_TS value) and the time when the Repository last wrote this row (LAST_UPDATE_TS). Indicates lag time, if any, between WMS statistics and Repository statistics.
Table 3-4 QUERY_RUNTIME_STATS_V1 Field Definitions (continued) Field Name (* means available only in this view) Data Type SQL_SPACE_USED* 32 1 Description INTEGER SIGNED NO DEFAULT Amount of “space” type (static) memory, in kilobytes, actually used for query processes (master executor and ESPs) during query execution. It should be less than or equal to the SQL_SPACE_ALLOCATED value. Maximum value of SQL_SPACE_USED reached over the life of the query.
Table 3-4 QUERY_RUNTIME_STATS_V1 Field Definitions (continued) Field Name (* means available only in this view) Data Type Description STATS_ERROR_CODE* INTEGER SIGNED NO DEFAULT Usually the warning number that is returned to the stats collector while obtaining statistics from RMS. A warning of 8922 means that one or more nodes did not report the statistics for the given query. DISK_IOS* LARGEINT SIGNED NO DEFAULT Number of physical disk I/O operations performed for this statement.
Table 3-4 QUERY_RUNTIME_STATS_V1 Field Definitions (continued) Field Name (* means available only in this view) Data Type EST_COST* DOUBLE PRECISION NO DEFAULT Estimated cost (time in seconds) of the SQL operations in the Master Executor. The estimate occurs at the time the query is prepared. EST_IO_TIME* DOUBLE PRECISION NO DEFAULT Estimate of the number of seconds of I/O time (seeks plus data transfer) to perform the I/O for this query. The estimate occurs at the time the query is prepared.
Table 3-4 QUERY_RUNTIME_STATS_V1 Field Definitions (continued) Field Name (* means available only in this view) Data Type Description COMPILE_ELAPSED_TIME* INTERVAL SECOND(12,6) NO DEFAULT Calculated compile time in microseconds, computed as compilation end time minus compilation start time. If compilation start time (COMPILE_START_TS), end time (COMPILE_END_TS), or both are NULL, this value is also NULL; when those values are updated, this value is also updated.
Table 3-4 QUERY_RUNTIME_STATS_V1 Field Definitions (continued) Field Name (* means available only in this view) Data Type 36 Description STATEMENT_TYPE CHAR(21) or NCHAR(21) NO DEFAULT The SQL statement as returned by the Neoview SQL compiler, one of SELECT_UNIQUE, SELECT_NON_UNIQUE, INSERT_UNIQUE, INSERT_NON_UNIQUE, UPDATE_UNIQUE, UPDATE_NON_UNIQUE, DELETE_UNIQUE, DELETE_NON_UNIQUE, CONTROL, SET_TRANSACTION, SET_CATALOG, SET_SCHEMA, CALL_NO_RESULT_SETS, CALL_WITH_RESULT_SETS, SP_RESULT_SET, OTHER, UNK
Table 3-4 QUERY_RUNTIME_STATS_V1 Field Definitions (continued) Field Name (* means available only in this view) Data Type Description REFRESH_TS TIMESTAMP(6) NO DEFAULT ANSI Timestamp indicating when the Workload Management Services received the most recent runtime statistics from the Query Executor. LAST_UPDATE_TS TIMESTAMP(6) NO DEFAULT Repository-generated ANSI Timestamp showing when this row was last updated. You can use this value to monitor whether the query is still running.
• • If a data type is given as CHAR or NCHAR, then CHAR applies if the character set is ISO88591, and NCHAR applies if the character set is UCS2. If a data type is given as VARCHAR or NCHAR VARYING, the VARCHAR applies if the character set is ISO88591, and NCHAR VARYING applies if the character set is UCS2. The primary key for ODBC_SESSION_STATS_V1 field definition is SEGMENT_ID, NODE_ID, and SESSION_EVENT_DATETIME_UTC.
Table 3-5 ODBC_SESSION_STATS_V1 Field Definitions (continued) Field Name Data Type Description TOTAL_CATALOG_STMTS LARGEINT Total number of SQL catalog statements sent by the HP ODBC driver to the NDCS SQL server. TOTAL_CLOSES LARGEINT Total number of SQL CLOSE calls sent by the HP ODBC driver to the NDCS SQL server. TOTAL_DELETE_STMTS_EXECUTED LARGEINT Total number of SQL DELETE statements sent by the HP ODBC driver to the NDCS SQL server. Does not include internally generated SQL statements.
Table 3-5 ODBC_SESSION_STATS_V1 Field Definitions (continued) Field Name Data Type Description PIN INTEGER UNSIGNED Process identification number of the NDCS server. START_PRIORITY SMALLINT UNSIGNED Execution priority of the NDCS process at the time the connection request was received. SESSION_STATUS CHAR(5) or NCHAR(5) START if this record contains information collected at the start of the session, or END if it contains statistics collected at the end of the session.
The primary key for ODBC_SESSION_STATS_V2 field definition is SEGMENT_ID, NODE_ID, and SESSION_EVENT_DATETIME_UTC.
Table 3-6 ODBC_SESSION_STATS_V2 Fields (continued) Complete Sessions 42 Incomplete Sessions Data Type Source and Notes SESSION_END_DATETIME_UTC SESSION_START_DATETIME_UTC TIMESTAMP END, or NULL for an incomplete session SESSION_END_DATE_UTC SESSION_END_DATE_UTC DATE END, or NULL for an incomplete session SESSION_ END _TIME_UTC SESSION_ END _TIME_UTC TIME END, or NULL for an incomplete session SESSION_STATE SESSION_STATE CHAR(14) or NCHAR(14) 'INCOMPLETE' or 'COMPLETE' TOTAL_CATALOG_STMTS
Table 3-6 ODBC_SESSION_STATS_V2 Fields (continued) Complete Sessions Incomplete Sessions Source and Notes Data Type TOTAL_MASTER_EXEC_EXECUTION_TIME LARGEINT END, or NULL for an incomplete session TOTAL_PREPARES LARGEINT END, or NULL for an incomplete session TOTAL_SELECT_STMTS_EXECUTED LARGEINT END, or NULL for an incomplete session TOTAL_UPDATE_STMTS_EXECUTED LARGEINT END, or NULL for an incomplete session TOTAL_WARNINGS LARGEINT END, or NULL for an incomplete session Processing Node St
Table 3-7 NODE_STATS_V1 Field Definitions (continued) 44 Field Name Data Type Description MEASURE_END _TIME TIME(6) ANSI SQL time, in Local Civil Time, indicating when the measurement interval ended. MEASURE_END _DATETIME_UTC TIMESTAMP(6) ANSI SQL timestamp, in Coordinated Universal Time, indicating when the measurement interval ended. MEASURE_END _DATE_UTC DATE ANSI SQL date, in Coordinated Universal Time, indicating when the measurement interval ended.
Table 3-7 NODE_STATS_V1 Field Definitions (continued) Field Name Data Type Description INTR_BUSY_TIME LARGEINT Time, in microseconds, that the processing node spent executing interrupt handlers. DISC_IOS LARGEINT Number of I/O disk transfers performed by disk processes in this processing node. CACHE_HITS LARGEINT Number of times the required block was found in cache during an I/O operation.
VIEW NEO.HP_METRICS.PROCESS_STATS_V1 NOTE: The process statistics are not turned by default and are scheduled to be deprecated. This view is populated only if process data collection is enabled. In this view, all CHARACTER columns use ISO88591 encoding, regardless of the underlying Neoview platform configuration. The primary key for PROCESS_STATS_V1 field definition is SEGMENT_ID, NODE_ID, PIN, and METRIC_CLASS_ID.
Table 3-8 PROCESS_STATS_V1 Field Definitions (continued) Field Name Data Type Description MEASURE_START_DATE_UTC DATE ANSI SQL date, in Coordinated Universal Time, indicating when the measurement interval began MEASURE_START_TIME_UTC TIME(6) ANSI SQL time, in Coordinated Universal Time, indicating when the measurement interval began DELTA_TIME LARGEINT Duration of the measurement in microseconds SEGMENT_NAME CHARACTER(8) Neoview segment name PROCESS_NAME CHARACTER(8) Name of the process bei
Table 3-8 PROCESS_STATS_V1 Field Definitions (continued) Field Name Data Type Description EXT_SEGS_QUE_TIME LARGEINT Time, in microseconds, that extended segments were allocated to the process RECV_QUE_TIME LARGEINT Time, in microseconds, that messages spent waiting on a process message input queue MESSAGES_SENT LARGEINT Number of messages sent by the process (associated with I/O operations and some system procedure calls) SENT_BYTES LARGEINT Number of bytes sent by the process RETURNED_BYTES
Aggregates represent differences between the previous aggregation period and the current aggregation period. In the case of an NDCS server process or a Neoview SQL compiler process, statistics are not really aggregates because each record represents only one process. In this view, all CHARACTER columns use ISO88591 encoding, regardless of the underlying Neoview platform configuration. The primary key for PROCESS_AGGR_LEVEL1_STATS_V1 field definition is SEGMENT_ID, NODE_ID, PIN, and SAMPLE_DATETIME_UTC.
Table 3-9 PROCESS_AGGR_LEVEL1_STATS_V1 Field Definitions (continued) 50 Field Name Data Type Description MIN_PRIORITY INTEGER UNSIGNED Minimum creation priority for all processes described by this record AVG_PRIORITY INTEGER UNSIGNED Average creation priority all processes described by this record MAX_PRIORITY INTEGER UNSIGNED Maximum creation priority for all processes described by this record CHILD_COUNT INTEGER UNSIGNED Number of processes included in this aggregation TOTAL_CHILD_ELAPSED
Table 3-9 PROCESS_AGGR_LEVEL1_STATS_V1 Field Definitions (continued) Field Name Data Type Description BUSY_HISTOGRAM_50-75 LARGEINT Number of processes with a CPU busy percentage between 50 and 75 BUSY_HISTOGRAM_75_95 LARGEINT Number of processes with a CPU busy percentage between 75 and 95 BUSY_HISTOGRAM_95 LARGEINT Number of processes with a CPU busy percentage greater than 95 AVG_HISTOGRAM_1 LARGEINT Average percent busy of all processes with a CPU busy percentage less than 1 AVG_HISTOGRAM
Table 3-9 PROCESS_AGGR_LEVEL1_STATS_V1 Field Definitions (continued) 52 Field Name Data Type Description STDDEV _HISTOGRAM_50-75 LARGEINT Standard deviation of percent busy for processes with a CPU busy percentage between 50 and 75 STDDEV _HISTOGRAM_75_95 LARGEINT Standard deviation of percent busy for processes with a CPU busy percentage between 75 and 95 STDDEV _HISTOGRAM_95 LARGEINT Standard deviation of percent busy for processes with a CPU busy percentage greater than 95 TOTAL_CHILD_READY
Table 3-9 PROCESS_AGGR_LEVEL1_STATS_V1 Field Definitions (continued) Field Name Data Type Description NUMBER_OF_CHILDREN_W_PAGE_FAULTS INTEGER UNSIGNED Count of processes with page faults MIN_NUMBER_OF_PAGE_FAULTS INTEGER UNSIGNED Among processes that had page faults, the smallest number of page faults AVG_NUMBER_OF_ PAGE_FAULTS INTEGER UNSIGNED Among processes that had page faults, the average number of page faults MAX_NUMBER_OF_ PAGE_FAULTS INTEGER UNSIGNED Among processes that had page faul
Table Statistics The Repository includes two views that provide access to data about tables or materialized views whose histogram statistics are missing or out of date. The views have identical column definitions but satisfy different purposes: • TABLE_STATS_V2 provides the most recently collected data for each monitored object. Thus, the view includes only one row per monitored table or materialized view.
Table 3-10 TABLE_STATS_V2 and TABLE_STATS_DETAIL_V2 Field Definitions Field Name Data Type Description FIRST_SUBMIT_TS TIMESTAMP(6) Timestamp in Local Civil Time when the data in this record was first submitted to the Repository. LATEST_SUBMIT_TS TIMESTAMP(6) Timestamp in Local Civil Time when the data in this record was most recently submitted to the Repository. CATALOG_NAME CHAR(128) or NCHAR(128) Name of the catalog in which the object (e.g.
Table 3-10 TABLE_STATS_V2 and TABLE_STATS_DETAIL_V2 Field Definitions (continued) Field Name Data Type Description MAX_STATS_TS TIMESTAMP(6) Timestamp, in Local Civil Time, of the most recent update statistics operation on the table. If there is no HISTOGRAMS table or no row for this object, the value in this field is NULL. DISTINCT_STATS SMALLINT UNSIGNED Number of times update statistics has run on the table.
Table 3-11 DISK_STATS_V1 Field Definitions Field Name Data Type Description SUBMIT_TS TIMESTAMP(6) Timestamp, in Local Civil Time, indicating when the measurement was submitted to the Repository SEGMENT_ID SMALLINT UNSIGNED Neoview platform segment number VOLUME_NAME CHAR(8) Logical disk volume name NODE_ID SMALLINT UNSIGNED Primary processing node number of the disk process for this volume PIN SMALLINT UNSIGNED Process identification number of the disk process for this volume SEGMENT_NAME
Table 3-11 DISK_STATS_V1 Field Definitions (continued) Field Name Data Type Description CACHE_HITS_PER_SEC SMALLINT UNSIGNED Total cache hits per second for this interval, for all block sizes RECEIVE_QUEUE_LEN_PCT DECIMAL(7,2) Disk process receive queue length integrated over the sample interval, expressed as a percentage IO_REQS_PER_SEC DECIMAL(9,1) Number of disk input/output requests per second for this interval BLOCKED_REQS_PER_SEC SMALLINT UNSIGNED Number of disk requests blocked per seco
Table 3-11 DISK_STATS_V1 Field Definitions (continued) Field Name Data Type Description BUSY_READS_PCT DECIMAL(6,1) Percentage of time that the primary disk was busy reading during this interval INPUT_KB_PER_SEC DECIMAL(9,1) Input kilobytes per second during this interval for the primary disk OUTPUT_KB_PER_SEC DECIMAL(9,1) Output kilobytes per second during this interval for the primary disk READS_PER_SEC_MIR DECIMAL(9,1) Number of disk process read operations per second for this interval, for
Table 3-12 Field Name Mapping from ACCESS_ODBCMX_QUERY_STATS_V1 to ODBC_QUERY_STATS_V1 Field Name in ACCESS_ODBCMX_QUERY_STATS_V1 Field Name in ODBC_QUERY_STATS_V1 CPU_NUM NODE_ID ENTRY_ID QUERY_EVENT_DATETIME_UTC, QUERY_EVENT_DATE_UTC, QUERY_EVENT_TIME_UTC ENTRY_ID_LCT QUERY_EVENT_DATETIME, QUERY_EVENT_DATE, QUERY_EVENT_TIME ESTIMATED_COST EST_COST DISC_READS DISK_READS LOCKESCALATIONS LOCK_ESCALATIONS LOCKWAITS LOCK_WAITS MSGSBYTESTODISC MESSAGE_BYTES_TO_DISK MSGSTODISC MESSAGES_TO_DISK
Table 3-13 Field Name Mapping from ACCESS_ODBCMX_QUERY_STATS_V2 to ODBC_QUERY_STATS_V2 (continued) Field Name in ACCESS_ODBCMX_QUERY_STATS_V2 Field Name in ODBC_QUERY_STATS_V2 DISC_READS DISK_READS LOCKESCALATIONS LOCK_ESCALATIONS LOCKWAITS LOCK_WAITS MSGSBYTESTODISC MESSAGE_BYTES_TO_DISK MSGSTODISC MESSAGES_TO_DISK The following table shows how fields defined in the view ACCESS_ODBCMX_SESSION_DATA_V1 were renamed in the view ODBC_SESSION_STATS_V1.
Summary of Field Definition Changes from Repository 2.2 This section describes field definition changes between Repository 2.2 and Repository 2.3. The following table shows how fields defined in the view QUERY_RUNTIME_STATS_V1 were renamed in Repository 2.3. Table 3-16 Field Definition Changes for QUERY_RUNTIME_STATS_V1 from Repository 2.2 to Repository 2.3 Field Name in Repository 2.2 Change in Repository 2.3 SQL_PROCESS_BUSY_TIME Now has data type INTERVAL SECOND(12,6).
Table 3-17 Field Name Mapping from TABLE_STATS_V1 to TABLE_STATS_V2 (continued) Field Name in TABLE_STATS_V1 Change in TABLE_STATS_V2 — REORG_STATUS is new in Repository 2.3. — MISSING_STATS_COUNT is new in Repository 2.3. Summary of Field Definition Changes from Repository 2.
4 Examples and Guidelines for Creating Repository Queries Overview This section lists some simple queries against the available Repository views and provides a few suggestions for writing Repository queries. NOTE: More realistic examples of Repository queries are included in the Neoview Reports product. Queries in this section are simple examples provided as an introduction to the Repository.
Retrieve Statistics for Completed Queries This query lists information for the ten most recent queries that terminated normally. You could enhance this query to filter for time ranges, user IDs, or other attributes. The list following the query shows values that might be returned in a single record. select [first 10] * from NEO.HP_METRICS.
Field Value "QUERY_END_DATE_UTC" 2007-05-24 "QUERY_END_TIME_UTC" 05:30:05 "EST_COST" NULL "QUERY_ELAPSED_TIME" 2325 "MASTER_EXEC_EXECUTION_TIME" 16-7 "DISK_READS" 0 "LOCK_ESCALATIONS" 0 "LOCK_WAITS" 0 "MESSAGE_BYTES_TO_DISK" 177744 "MESSAGES_TO_DISK" 18 "ROWS_ACCESSED" 20 "ROWS_RETRIEVED" 20 "NUM_ROWS_IUD" NULL "TOTAL_EXECUTES" 1 "SQL_TEXT" "select AVG(CPU) CPU, AVG(MEMORY) MEMORY,…" Retrieve Statistics for Incomplete Queries This query lists information about queries that have
Field Value "DATASOURCE" "neo0102_clo" "QUERY_ID" "MXID01001000882212041585284557791000000000509seethadba00_118 _SQL_CUR_26680060 "STATEMENT_ID" "SQL_CUR_26680060 " "STATEMENT_TYPE" "SQL_SELECT-NON_UNIQUE" "STATEMENT_STATE" "INCOMPLETE" "QUERY_TEXT_IS_MULTIROW" "N" "ERROR_CODE" “” "SEQUENCE_NUM" 0 “SEQUENCE_SIZE” 0 "QUERY_START_DATETIME" 2007-05-23 22:30:05.867082 "QUERY_START_DATE" 2007-05-23 "QUERY_START_TIME" 22:30:05 "QUERY_START_DATETIME_UTC" 2007-05-24 05:30:05.
List System Utilization for a Process This query retrieves information about system utilization for a particular process (or set of processes). Usually, the process in question is a particular NDCS server (that is. an ODBC session). The result set represents CPU utilization for that server and for its child executor processes. Results are aggregated for 5 minute intervals. The results are ordered in chronological order.
Completed Queries Executed on a System in the Previous Two Days To count queries that executed from one midnight to the next, instead of within a 24 hour period relative to the current time, the following query uses the Neoview DATE_TRUNC function in the SQL WHERE clause. SELECT DISTINCT(QUERY_START_DATE) AS START_DATE, COUNT(*) AS NUM_OF_QUERIES, MAX(QUERY_START_TIME) AS MAX_START_TIME, MIN(QUERY_START_TIME) AS MIN_START_TIME FROM NEO.HP_METRICS.
ORDER BY datasource FOR READ UNCOMMITTED ACCESS; DATASOURCE NUM_OF_QUERIES NEO0101_JOM 51 TDM_Default_DataSource 44 neodb 162 Queries within the Past 24 Hours, Grouped by Client ID and Including Average and Maximum Elapsed Time SELECT client_id, COUNT(*) AS num_of_queries, AVG(query_elapsed_time)/1000 AS avg_qry_elapsed_msec, MAX(query_elapsed_time)/1000 AS max_qry_elapsed_msec FROM NEO.HP_METRICS.
RR fensterm-dc76c 1476 TXNROGERSOJ-P2 59 JDI_REPOS Smart_JLverne TXNJLVERNE1 TDM_Default_DataSource REVSTADTBR TDM_Default_DataSource REVKAZUKO TDM_Default_DataSource TXNLAZLON-DC76 TDM_Default_DataSource FENSTERM-DC76C TDM_Default_DataSource golden.fargo.c TDM_Default_DataSource chiarp-d530u TDM_Default_DataSource vleemgar-dc76 TDM_Default_DataSource vleemgar-dc76c TDM_Default_DataSource nwestabx-dc76c TDM_Default_DataSource pdict TDM_Default_DataSource watanabe.fargo.
Retrieving Multirow Queries Queries that are longer than 3200 bytes are broken into multiple rows. Three fields support retrieving the complete text of these kinds of queries: • • • QUERY_TEXT_IS_MULTIROW indicates whether multiple rows are required to accommodate the text. SEQUENCE_SIZE gives the number of rows required to accommodate the text. SEQUENCE_NUM assigns sequential numbers to the rows.
For a much more extensive discussion of character sets on the Neoview platform, see the Neoview Character Sets Administrator's Guide.
Glossary Collector process A Repository process that collects metrics for a monitored entity. Execdirect A SQL statement or call that executes a query directly, as opposed to using a previously prepared statement. Manageability Repository A database and related components for collecting metric data about resources on a Neoview platform and making that data available to consumers, by means of APIs.
Index separate rows for start and end of query, 22 single row per query, 26 views that expose, 21 A Aggregate statistics for processes, 48 C R CPU statistics (see Processing node statistics) Repository features and interfaces, 13 Retention times for Repository data, 18 RTS defined, 75 D Default configuration, 18 Disk statistics, 56 Documents, related information, 10 E Example query count completed queries, 69 number of rows in a view, 65 retrieve a specified number of rows, 65 statistics for incomple