HP Database Manager (HPDM) User Guide HP Part Number: 597527-001 Published: March 2010 Edition: HP Neoview Release 2.
© Copyright 2010 Hewlett-Packard Development Company, L.P. Legal Notice Confidential computer software. Valid license from HP required for possession, use or copying. Consistent with FAR 12.211 and 12.212, Commercial Computer Software, Computer Software Documentation, and Technical Data for Commercial Items are licensed to the U.S. Government under vendor’s standard commercial license. The information contained herein is subject to change without notice.
Table of Contents Learn About This Document...............................................................................................9 Publishing History..................................................................................................................................9 New and Changed Information..............................................................................................................9 Intended Audience..................................................................
Customize HPDM Windows................................................................................................................32 Manage Windows.................................................................................................................................32 Get Version and Build Information......................................................................................................33 4 Perform Basic HPDM Operations...........................................................
Usage Tab.........................................................................................................................................53 DDL Tab...........................................................................................................................................54 Statistics Tab....................................................................................................................................54 Privileges Tab...................................................
See the Parts of the System Monitor.....................................................................................................77 Understand the Performance Metrics...................................................................................................78 Use Tooltips to Show the Value of a Performance Metric....................................................................79 About the Timeline Tab..........................................................................................
10 Use the SQL Whiteboard.......................................................................................117 About the SQL Whiteboard................................................................................................................117 Display the SQL Whiteboard..............................................................................................................117 Learn About the SQL Whiteboard Panes................................................................................
Index...............................................................................................................................
Learn About This Document This guide describes how to use the HP Database Manager (HPDM) to monitor and manage a Neoview Data Warehousing Platform for Business Intelligence. Publishing History This guide supports HP Neoview Release 2.4 Service Pack 2 and all subsequent Release 2.4 product versions until otherwise indicated by its replacement publication.
Neoview Customer Library The manuals in the Neoview customer library are listed here for your convenience. Customer library manuals are available on the customer documentation Web site. “Resources on the Web” (page 11).
Neoview System Monitor Quick Start Instructions for starting, using, customizing, and troubleshooting the Neoview System Monitor. Neoview User Management Information Information about the logging of user-management actions on the Neoview platform and the facilities available for monitoring such actions. Neoview Workload Management Information about using Neoview Workload Management Services (WMS) to Services Guide manage workload and resources on a Neoview data warehousing platform.
Include the document title and part number shown below: Document Title: HP Database Manager (HPDM) User Guide Part Number: 597527-001 12
1 Install and Start HPDM What is the HP Database Manager? The HP Database Manager (HPDM) is an integrated graphical client that allows you to connect to and manage multiple HP Neoview platforms. HPDM provides database-object browsing and monitoring capabilities that are superior to the Neoview DB Admin product. HPDM requires the HP ODBC 2.0 client driver for Windows to connect to an HP Neoview platform. Download the HP ODBC 2.
— — Launches the Neoview Command Interface (NCI) Supports character sets for ISO, SJIS, or Unicode based on a single-client locale (only one character set can be configured for each install). Install the HP Database Manager The HP Database Manager is installed with a Windows installer. You can install the client by itself or as part of a bundle of Neoview clients provided by the Neoview Windows Client Package. Information about the installers can be found on the HP Software Depot web site.
• From the Start menu, select Start > All Programs > HP Database Manager > HP Database Manager. NOTE: Most HPDM features require you to connect to the Neoview data warehousing platform through the ODBC client driver. For more information, see “Connect to a System” (page 17). Use Menu Bar Commands The menu bar is the list of commands at the top of the HPDM main window. The menu bar commands are: File, Edit, Tools, Windows, and Help.
2 Connect and Disconnect Connect to a System If this is the first time you are attempting to connect to a system, you must create a system definition. See “Add a System” (page 20). If a system definition is already created, use these steps to connect: 1. Enter the Connect command by using either of these methods: • In the My Other Systems folder, right-click the system name, and select Connect. The Connect / Edit System dialog box appears.
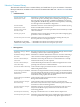
Fields Description User Name Your user name. Password Your Neoview password. Host The DNS name or IP address for the target Neoview platform. Port Number The NDCS server port number. Default Schema The default schema to use if composing a query. For the current release, if this field is left blank, the default schema is typically the schema matching your user name with any lowercase characters upshifted. Driver The installed Neoview ODBC driver to be used with this Neoview platform.
Terms disconnect Systems Tool Log On and Off You log on to HPDM as part of connecting to a system. See “Connect to a System” (page 17). To connect to a system, you must create a system definition. The system definition is saved and can be reused over and over again. After a system definition is created, you need only specify a password to connect to a system. The tool you use to work with system definitions is the Systems Tool. See “Use the Systems Tool” (page 19).
The button options for the Systems Tool are: Button Function [ Test ] Tests a selected system and displays the results in the Connection Test Result dialog box. [ Test ] is enabled if one or more systems are selected. [ Edit ] Launches the Connect / Edit System dialog box with the selected systems’ current settings. [ Edit ] is enabled if one or more systems are selected. [ Add ] Launches the Add System dialog box with blank settings, except for the port number (which defaults to 18650).
3. Click one of these buttons: NOTE: Once a system is added, the system definition persists from session to session unless it is removed. Button Description [ Add] Creates the new system definition, but does not attempt to connect to the system. [ Connect ] Attempts to create the new system using the entries specified in the Add System dialog box: • If the connection is successful, the entry for the system is created and appears in the Systems Tool window.
In the Add System dialog box, these buttons allow you to add a new system, add and connect to a new system, or cancel the operation. Button Description [ Add ] Creates the new system definition, but does not attempt to connect to the system. [ Connect ] Attempts to create the new system using the entries specified in the Add System dialog box: • If the connection is successful, the entry for the system is created and appears in the Systems Tool window.
Add a System Like... To add a system by modifying a copy of another system definition: 1. Use either of these methods to open the Add System Like dialog box: • In the navigation tree pane, right-click any system name, and select Add System Like This. The Add System Like dialog box is displayed. • Display the Systems Tool by selecting Tools > Systems Tool from the menu bar. Select the system definition that you want to copy. Then click [ Add Like ]. The Add System Like dialog box is displayed. 2.
1. 2. • Connect to the system as described in “Connect to a System” (page 17). In the My Active Systems folder, right-click the system, and select Test System. Initiate a test from the Systems Tool: 1. Connect to the system as described in “Connect to a System” (page 17). 2. Display the Systems Tool by selecting Tools > Systems Tool from the menu bar. 3. Select the connected system that you want to test. 4. Click [ Test ].
3 Navigate HPDM See the Parts of the HPDM Interface Related Topics “Use the Navigation Tree Pane” (page 27) “Use the Right Pane” (page 29) “Use the My Favorites Pane” (page 30) “Use Menu Bar Commands” (page 15) Select an Area To select an area, click one of the blue bars below the navigation tree pane: See the Parts of the HPDM Interface 25
Areas are broad categories of features that you can monitor or manage using HPDM. The supported areas are: Area Description Space Management Provides information about SQL-space usage on the system. See “Manage Disk Space” (page 125). Monitoring Provides alert and alarm information for the system. Provides the system message, as well as any other system-wide information that might be informative to an administrator or user.
To hide an area: 1. 2. Deselect the option for the area in the Show/Hide Area Options group box. Click [ OK ]. To show an area that is hidden: 1. 2. Select the option for the area in the Show/Hide Area Options group box. Click [ OK ]. Related Topics “Select an Area” (page 25) Terms area Use the Navigation Tree Pane The navigation tree pane is the left pane of HPDM below the My Favorites pane. “See the Parts of the HPDM Interface” (page 25).
To display the My Active Systems folder options, right-click the My Active Systems heading. The options are: Menu Item Description Add to Favorites Opens the New Favorite dialog box if a system definition is present and selected. If no system definition is present or selected, this command has no effect. Refresh Refreshes the selected object and all children for the object in the navigation tree. Add System Opens the Add System dialog box, allowing you to create a new system.
To display the My Other Systems folder options, right-click the My Other Systems folder and the options are: Menu Item Description Add to Favorites Opens the New Favorite dialog box if a system definition is present and selected. If no system definition is present or selected, this command has no effect. Refresh Refreshes the object and all children for the object in the navigation tree. Add System Creates a new system. See “Add a System” (page 20).
When My Active Systems or My Other Systems are selected, the buttons that are displayed in the bottom right pane are: Button Function [ Test ] Tests a selected system and displays the results in the Connection Test Result dialog box. [ Test ] is enabled if one or more systems is selected. [ Edit ] Launches the Edit System dialog box with the selected systems’ current settings. [ Edit ] is enabled if one or more systems is selected.
Create a Favorite To create a favorite, use either of these methods: • Drag and drop an object into the My Favorites pane: 1. Optional: If you want the favorite to reside in a folder in the My Favorites pane, and the folder does not exist yet, you must create the folder first. See “Create a Folder to Store Favorites” (page 31). 2. In the navigation tree pane, navigate to the object. 3.
1. 2. If necessary, create the folder. See “Create a Folder to Store Favorites” (page 31). Create a favorite in the desired folder by performing the steps in “Create a Favorite” (page 31). Share Your Favorites With Others You can save your favorites (and other personalized client settings) by saving and sharing a copy of your system definitions. See “Save and Import System Definitions” (page 39). Remove a Favorite To remove a favorite, right-click the favorite, and select Remove.
To open the Windows Manager, select Windows > Windows Manager from the menu bar. The Windows Manager buttons are: Button Description [ Window(s) To Front ] Moves the selected windows to the front. [ Close Window(s) ] Closes the selected windows but leaves the main window open. [ Main Window To Front ] Displays the main window. [ OK ] Closes the Windows Manager. Related Topics “Clone a Tab” (page 36) Get Version and Build Information Version and build information appears in the About box.
4 Perform Basic HPDM Operations Sort and Move Data Columns You might want to see rows in an HPDM display (for example, a list of schemas) grouped by a specific type of information. You can sort the displayed data based on column values. You can also change the order of the columns by dragging a column heading to the left or right. To change the sort order of a displayed column: • Click the title of the column that you want to sort.
2. Repeat as necessary until the columns are arranged the way you want them. Clone a Tab HPDM allows you to clone some tabs in a new window. This feature creates a copy of the selected tab and its information in a new window that can be resized and compared side-by-side with other cloned windows. This feature is especially useful if you want to monitor multiple systems or multiple aspects of the same system at the same time.
Save Data to a Spreadsheet [ Data to Spreadsheet ] transparently saves the table data to a temporary local file in standard HTML table format and then executes the file. Executing the temporary local file into an Excel file launches Excel on a windows system if Excel is installed. Export Data to a Browser [ Data to Browser ] invokes Internet Explorer or a default browser displaying the table data. The data is exported internally in standard HTML format. Internet Explorer is then invoked on this HTML file.
Navigate the System Message Tab The navigation of the System Message tab contains a tree of active and other systems. The right pane displays the system message for the selected active system. If an “other” system is selected, the system’s definition is displayed. Otherwise, selecting the My Active Systems or the My Other Systems folders displays a table displaying information about the systems under the folder. Create a System Message To create a system message: 1. 2. 3. 4.
Clone the System Message Tab If you double-click on the System Message tab, the control is cloned into a new window. When the contents of the system message are modified in any window (the main HPDM window or any cloned window), the change is immediately visible in all copies. Therefore, if the user types in one window, all of the other windows show the updated text. In addition, applying and refreshing any window affects the behavior in all other copies.
persistence file system definition Systems Tool View Event Messages View Dial Out and Database Events You can view dial out and database events with any area selected. Dial out events are system events that are dialed out to HP Support. Database events are events related to database activity, data loads, and queries. In the current release, only these users can view dial out and database events: • super.super • super.
Parameter Attribute sequence number Messages too large for one message template are divided into smaller messages. Sequence number indicates which part of the message you are viewing. The sequence number is 0 for the first or only part of a message, and 1 for the additional parts, if any. function-input-parameters List of input parameters to the function. function-exit-parameters List of output parameters from the function. 21034 See above. Cause Effect A trace informational message.
Session Statistics: Connection Information Session statistics are written to the alternate EMS collector at the time the connection is made (listed in the order written in the event message): Statistic Description Session ID Unique session ID generated by the NDCS server at the time the connection is established. Message Attribute SESSION:ConnectionInformation (the statistics option that was selected). Sequence Number Message sequence number generated by NDCS.
Statistic Description TotalSelectStmtsExecuted Total number of SQL SELECT statements sent by the HP ODBC driver to the NDCS SQL server; does not include internally generated SQL statements. TotalCatalogStmts Total number of SQL Catalog statements sent by the HP ODBC driver to the NDCS SQL server. TotalPrepares Total number of SQLPrepare calls. TotalExecutes Total number of SQLExecute calls. TotalFetches Total number of SQLFetch calls. TotalCloses Total number of SQLClose calls.
Statistic Description ErrorCode Execute error code, if any. A zero (0) indicates that the execute was successful. RowsAccessed Cumulative number of rows accessed. RowsRetrieved Cumulative number of rows retrieved. DiscReads Cumulative number of disk reads. MsgsToDisc Number of messages sent to the disk process. MsgsBytesToDisc Size, in bytes, of the total number of messages sent to the disk process. LockWaits Number of lock waits (this is the concurrency cost).
Statement Statistics: SQLPrepare SQLPrepare statistics are written to the alternate EMS collector at the time a PREPARE statement is received (listed in the order written in the event message): Statistic Description Session ID Unique session ID generated by the NDCS SQL server at the time the connection is established. Message Attribute STATEMENT:SQLPrepare (Statistics option that was selected.
5 Manage Database Objects This section describes how to display schemas, tables, table indexes, views, materialized views, materialized view indexes, materialized view groups, procedures, synonyms, and triggers in HPDM. Display Schemas and Their Objects To display the schema names and attributes for the schema: 1. 2. 3. 4. Start the HP Database Manager and log on using any user ID. Click the Database area. HPDM displays a list of existing schemas and their owners.
Attributes Tab To display the schema attributes and values that belong to the schema: 1. 2. Navigate to the Schema folder and click the name of the schema to see information about the schema and its objects. Click the Attributes tab in the right pane. In the right pane, these attributes are displayed: • Name: Name of the schema. • Owner: The owner of the schema. • Version: Specfies the version of the schema. Tables Tab To display the table names that belong to the schema: 1. 2.
Views Tab To display the views that belong to the schema: 1. 2. Select aSchema in the navigation tree. Click the Views tab in the right pane, or open the Views folder. In the right pane, these attributes are displayed: • Name: Name of the view. Each view is hyperlinked and detailed information about the view is displayed. • Creation Time: Time and date when the view was created. Timestamp is in the format (yyyy-MM-dd HH:mm:ss.FFFFFF local time).
Privileges Tab To display the privilege information for the schema: 1. 2. Select a Schema in the navigation tree. Click the Privileges tab in the right pane. The Privileges tab displays a table showing the access privileges: • • • • • Grantee: The name of a user or role whose privilege is being described. Grantor: The name of the user or role who granted the privileges and the special SQL user names “PUBLIC” and “SYSTEM.” With Grant: Specifies an ‘X’ to indicate if the user or role has grant privileges.
In the right pane, these tabs appear: • Columns tab • Primary Key tab • Hash Key tab • Unique Constraints tab • Foreign Keys tab • Attributes tab • Partitions tab • Usage tab • DDL tab • Statistics tab • Privileges tab You can also expand Tables to display a table list in the left pane. Each table in the navigation tree contains a folder called Indexes and a folder called Triggers. The Indexes folder expands to show the indexes of a specified table.
• • • • • Primary Key: Specifies the icon or special symbol to indicate column is part of the primary key. Column Name: Name of the column (string). Data Type: SQL datatype of the column. Nullable: If a column is NOT NULLABLE NOT DROPPABLE, the value displayed is “Not Nullable.” If the column is NOT NULL, the value displayed is “Not Nullable.” If the column is NULL, the value is blank. Default: For schema version 2300 or earlier, the default value displayed is “GENERATED BY DEFAULT AS IDENTITY”.
1. 2. Select a Schema in the navigation tree and click the table name in the right pane, or open the Tables folder and select a table name in the tree. Click the Foreign Key tab in the right pane. In the right pane, these attributes are displayed: • Name: Name of the foreign key constraint. • Foreign Table: Name of the foreign table. • Local Column: Name of the local column of the foreign key. • Foreign Column: Name of the foreign column of the foreign key.
1. 2. Select a Schema in the navigation tree and click the table name in the right pane, or open the Tables folder and select a table name in the tree. Click the Usage tab in the right pane. The Usage tab displays the usage relationships of the table with other objects, if any. The attributes displayed are : • Relationship: Specifies the relationship of the table with the object specified. The values are: “Uses”, “Used By”, “Has.” • Related Object Type: Specifies the object type of the related object.
• Grant Level: The level at which the permissions are visible. The values displayed in this column are: Schema, Object, or Column. — Schema indicates permissions have been applied to the schema. — Object indicates permissions were applied directly to the object whose permissions are being displayed. — Column indicates the permissions applied to the column.
In the right pane, these tabs appear: • • • • Columns tab Attributes tab DDL tab Partitions tab Columns Tab To display the table index columns: 1. 2. 3. Select a Schema in the navigation tree. Click the Tables folder and open the Indexes folder and select an index name. Click the Columns tab in the right pane. In the right pane, these attributes are displayed: • Column Name: Name of the column (string). • Sort Order: Specifies the order as “Ascending” or “Descending.
• • • Populated: Specifies if the index has been populated, the value is “Yes” or “No.” Creation Time: Time and date when the table index was created. Timestamp is in the format (yyyy-MM-dd HH:mm:ss.FFFFFF local time). Redefinition Time: Time and date when the table index was last redefined. Timestamp is in the format (yyyy-MM-dd HH:mm:ss.FFFFFF local time). DDL Tab To display the DDL output for table indexes: 1. 2. 3. Select a Schema in the navigation tree.
Display Views and Their Properties To display the view information: 1. 2. 3. 4. 5. Start the HP Database Manager and log on using any user ID. Click the Database area. Select a system in My Active Systems in the navigation tree. Select a Schema in the navigation tree. Select the Views tab in the right pane, or open the Views folder and select a view. HPDM displays the views in this schema.
• • • Data Type: SQL datatype of the column. Nullable: If column is NOT NULL NOT DROPPABLE, the value displayed is “Not Nullable.” If the column is NOT NULL, the displayed value is “Not Nullable.” If the column is NULL, the value is blank. Default: The default of the column. Usage Tab To display the usage information for a view: 1. 2. 3. Select a Schema in the navigation tree. Click the Views tab, or open the Views folder and select a view. Click the Usage tab in the right pane.
— — — • Schema indicates permissions have been applied to the schema. Object indicates permissions were applied directly to the object whose permissions are being displayed. Column indicates the permissions applied to the column. When an object level privilege applies to all columns, the individual column privileges are not displayed, otherwise the individual column level permissions are listed. Privileges: Describes the privilege of the user or role.
• • DDL tab Privileges tab Attributes Tab To display the materialized view attributes: 1. 2. 3. Navigate to the Schema in the navigation tree Click the Materialized Views tab in the right pane and select a materialized view name, or open the Materialized Views folder and select a materialized view name in the tree. Click the Attributes tab in the right pane. In the right pane, these attributes are displayed: • Name: External name of the materialized view.
• • Creation Time: Time and date when the materialized view was created. Timestamp is in the format (yyyy-MM-dd HH:mm:ss.FFFFFF local time). Redefinition Time: Time and date when the materialized view was last redefined. Timestamp is in the format (yyyy-MM-dd HH:mm:ss.FFFFFF local time). Partitions Tab To display the materialized view partitions: 1. 2. 3.
For more information about displaying DDL, see “Display Schema DDL and Their Properties” (page 73). Privileges Tab To display the privileges for the materialized view: 1. 2. 3. Select a Schema in the navigation tree. Click the Materialized Views tab in the right pane and select a materialized view name, or open the Materialized Views folder and select a materialized view name in the tree. Click the Privileges tab in the right pane. The Privileges tab displays a table showing the access privileges.
4. 5. 6. Select a Schema in the navigation tree. Open the Materialized Views folder, select and open a Materialized View. Open the Indexes folder and select a materialized view index in the tree. In the right pane, these tabs appear: • • • • Columns tab (user only) Attributes tab DDL tab Partitions tab Columns Tab To display the materialized view index columns: 1. 2. 3. 4. Select a Schema in the navigation tree. Open the Materialized Views folder, select and open a materialized view.
For more information about displaying DDL, see “Display Schema DDL and Their Properties” (page 73). Partitions Tab To display partition information for a materialized view index: 1. 2. 3. 4. Select a Schema in the navigation tree Open the Materialized Views folder, select and open a Materialized View. Open the Indexes folder and select a materialized view index in the tree. Click the Partitions tab in the right pane.
In the right pane, these tabs appear: • • • Attributes tab Members tab DDL tab Attributes Tab To display the materialized view groups attributes: 1. 2. 3. Select a Schema in the navigation tree. Click the Materialized View Groups tab in the right pane, or open the Materialized View Groups folder and select a materialized view group name in the tree. Click the Attributes tab in the right pane. In the right pane, these attributes are displayed: • Name: Name of the materialized view group.
1. 2. 3. Select a Schema in the navigation tree. Click the Materialized View Groups tab in the right pane, or open the Materialized View Groups folder and select a materialized view group name in the tree. Click the Members tab in the right pane. In the right pane, the members are displayed in a table with the following attributes: • Name: Name of the materialized view group member. The object names are 2–part ANSI names. • Creation Time: Time and date when the materialized view group member was created.
In the right pane, these tabs appear: • • • Attributes tab Parameters tab Privileges tab Attributes Tab To display the procedure names and attributes: 1. 2. 3. Select a Schema in the navigation tree. Click the Procedures tab in the right pane and select a synonym name, or open the Procedures folder and select a procedure name in the tree. Click the Attributes tab in the right pane. In the right pane, these attributes are displayed: • Name: The name of the procedure.
Parameters Tab To display the procedure parameter information: 1. 2. 3. Select a Schema in the navigation tree. Click the Procedures tab in the right pane and select a procedure name, or open the Procedures folder and select a procedure name in the tree. Click the Parameters tab in the right pane. In the right pane, these attributes are displayed: • Name: Name of the parameter. • Direction: The values displayed are: IN | OUT | INOUT. IN passes data to the procedure. OUT accepts data from the procedure.
4. 5. Select a Schema in the navigation tree. Click the Synonyms tab in the right pane and select a synonym name, or open the Synonyms folder and select a synonym name in the tree. In the right pane, these tabs appear: • • • Attributes tab Usage tab DDL tab Attributes Tab To display the synonym names and attributes: 1. 2. 3. Select a Schema in the navigation tree. Click the Synonyms tab in the right pane and select a synonym name, or open the Synonyms folder and select a synonym name in the tree.
1. 2. 3. Select a Schema in the navigation tree. Click the Synonyms tab in the right pane and select a synonym name, or open the Synonyms folder and select a synonym name in the tree. Click the Usage tab in the right pane. The Usage tab displays the usage relationships of the synonym with other objects, if any. These attributes displayed are: • Relationship: Specifies the relationship of the synonym with the object specified. The value is “References.
In the right pane, these tabs appear: • • • Attributes tab Usage tab DDL tab Attributes Tab To display the trigger attributes: 1. 2. 3. Select a Schema in the navigation tree. Click the table name in the right pane, or open the Tables folder and then open the Triggers folder and select a trigger in the tree. Click the Attributes tab in the right pane. In the right pane, these attributes are displayed: • Name: Name of the trigger. • Is Enabled: Specifies if the trigger is enabled.
Usage Tab To display the trigger usage information: 1. 2. Select a Schema in the navigation tree and click the table name in the right pane, or open the Tables folder and then open the Triggers folder and select a trigger in the tree. Click the Usage tab in the right pane. In the right pane, these attributes are displayed: • Relationship: Specifies the relationship between this trigger and the object. • Related Object Type: Specifies the object type of the object.
The external format of the Show DDL output is displayed. For more information on the format of the Show DDL command, see the Neoview SQL Reference Manual. Show DDL Show DDL allows you to select objects for which you want DDL output fetched and displayed. NOTE: Opening up Show DDL to the system-level allowing you to select different catalogs and schemas and their objects may cause performance issues. To avoid performance issues, Show DDL limits the selection to a specific schema.
• • The DDL Output pane has a text box with scroll bars and the DDL output is displayed in the text box. The Show DDL dialog box options are: Button Description [ Load ] Loads the Show DDL output of the selected objects (with check boxes selected) and replaces the contents in the DDL Output pane. [ Append ] Appends the selected objects to the existing contents in the DDL Output pane. [ Clear All ] Clears selected objects (with check boxes selected) in the Selected Objects pane.
3. 4. Select a Schema in the navigation tree. Click the Statistics tab in the right pane. The Statistics tab displays the histogram statistics for the table. For each column in the table, the data is fetched from the HISTOGRAMS UMD table. The right pane displays these attributes: • Name: Name of the column. • Datatype: Specifies the column datatype. • # Nulls: The number of null values for the column. An interval (bucket) with "(NULL)” as the boundary value from the histogram_intervals table.
6 Use the System Monitor Display the System Monitor The system monitor is a tool within HPDM that displays status and performance data for the Neoview platform. The displayed status and performance data includes seven performance metrics and four system status icons. NOTE: The system monitor is visible for both connected and disconnected systems. The system monitor uses TCP/IP UDP datagrams to communicate with a server component on the Neoview platform.
Related Topics “Configure System Monitor Options” (page 82) “Understand the Performance Metrics” (page 78) “Understand the System Status Icons” (page 80) Terms segment Understand the Performance Metrics The system monitor shows seven performance metrics: Metric Description CPU Busy The average busy value of the specified processing node (CPU) over the last refresh interval. Disk I/O The average number of disk I/O operations over the last refresh interval.
“Use Tooltips to Show the Value of a Performance Metric” (page 79) Use Tooltips to Show the Value of a Performance Metric When the system monitor bar graph (Bar Graph tab) is displayed, you can quickly obtain the current value of a metric for a given segment and CPU. To obtain the current value, hold the cursor over the bar for the CPU.
About the Hybrid Tab The Hybrid tab shows a bar graph and a set of timelines side by side: Related Topics “About the Timeline Tab” (page 79) “Configure System Monitor Options” (page 82) Understand the System Status Icons The four system status icons (Connectivity, Disks, Transactions, and Alerts) provide an at-a-glance summary of the up or down state of various subsystems and tell you if any alerts are present: 80 Use the System Monitor
This table describes the icons: Icon Description Connectivity Icon for the association servers. Indicates if $MXOAS and $MXAS2 are running. $MXOAS is the component of the Neoview Database Connectivity Service (NDCS) that receives client connection requests for database access and associates the requestor with a server to execute the requested access.
For more information about the Alerts icon, see “Get Information About Alerts” (page 89). Related Topics “Understand the System Status Icons” (page 80) “Get Information About Alerts” (page 89) Configure System Monitor Options The system monitor options pane allows you to control the display of performance metrics, including the bar colors, the refresh rate, and other parameters. To display the system monitor options pane: 1.
This table describes the system monitor options and settings: Option or Setting Description Port This option shows the Port Number for connecting to the Neoview platform. The default number is 4746, which should satisfy most installations. If the system monitor fails to return data and you suspect that a different port was assigned, contact your HP support representative. The Fixed Incoming option is provided for troubleshooting at sites where the client workstation is behind a firewall.
Option or Setting Description Additional Color Options Options that control the bar color for the mouse-over, threshold-exceeded, and CPU-down conditions. See “Change a Color Option” (page 85). Aggregation Options Options that control the way data collected (aggregated) for each bar in the bar graph (Bar Graph tab): • No Aggregation displays one bar per CPU (16 bars per segment). For example, the client shows 64 bars (16 CPUs per segment) for a four-segment platform.
“Configure System Monitor Options” (page 82) Terms segment Change a Color Option Color options appear as bar/line-color buttons in the system monitor options pane. To change a color option: 1. 2. 3. 4. 5. Display the system monitor options pane, as described in “Configure System Monitor Options” (page 82). Click the bar/line-color button for the metric or background whose color you want to change. The color palette dialog box appears. Select a color from the color palette. Click [ OK ]. Click [ Apply ].
7 Respond to Alerts Display the Alerts Tab NOTE: Diagnostic information displayed by the Alerts tab is intended for use by HP support. This information is not documented for customer use. If you have questions about an alert condition, contact your HP support representative. Special privileges are required to display the Alerts tab. See “Understand Privileges for Viewing and Updating Alerts” (page 88). To display the Alerts tab: 1. 2. 3.
Understand Alerts NOTE: Diagnostic information displayed by the Alerts tab is intended for use by HP support. This information is not documented for customer use. If you have questions about an alert condition, contact your HP support representative. Alerts are alarms or incident reports generated by internal subsystems. The system monitor provides a system status icon to summarize the alert condition, and the Alerts tab provides detailed information about specific alerts.
If the current user has update privileges, the ALARM_STATUS column in the Alerts data grid displays a menu with selectable update states (ACKNOWLEDGED and USERCLOSED): In addition, the ALARM_NOTES column provides a [ ... ] button that opens the Alert Notes Editor dialog box: If the current user does not have update privileges, the menu and notes button are not displayed.
Alerts Icon Color Description Yellow At least one OPEN or ACKNOWLEDGED alert is present and has a WARN alert level. Green No ERROR or WARN alerts are present, but informational (INFO) alerts might be present. Related Topics “Understand Row Detail Information for Alerts” (page 90) “Understand the System Status Icons” (page 80) Understand Row Detail Information for Alerts This table describes the row detail information for the Alerts data grid.
Field Description IR_STATUS The delivery status of an incident report (IR). Possible values are: CREATED, DELIVERED, FAILED DELIVERY, and UNKNOWN. This column indicates that a dial-out was generated by the Neoview platform, but not necessarily that the dial-out was successfully received by HP support. ALARM_CREATE_UTC_TS* The ANSI timestamp in universal coordinated time (UTC) when the alarm was created.
Terms alert segment Use the Alerts Options Dialog Box To display the Alerts Options dialog box: 1. 2. Display the Alerts tab, as described in “Display the Alerts Tab” (page 87). Click the [ Alter Alerts Configuration ] button: The Alerts Options dialog box appears. This table describes the alerts options and controls: Option or Control Description Open Alerts Only Causes the Alerts data grid to display only the open and acknowledged alerts.
Option or Control Description Time Range (server side LCT) Specifies the interval for which data is fetched in the server-side local civil time (LCT). By default, the Alerts data grid fetches alert details for the last 30 days.
Click this button . . . To do this Stop Data Provider Stop the refresh. Refresh Data Refresh the Alerts data grid at any time. Pause Timer Pause the refresh. Resume Timer Restart the refresh after pausing. Set Refresh Time Change the refresh interval. See the steps for doing this later in this topic. Alter Alerts Configuration Control the display of alerts. See “Use the Alerts Options Dialog Box” (page 92). To change the refresh interval: 1. 2.
2. In the Alerts data grid, right-click any alert (or multiple alerts), and select Update Alert(s). The Update Alert dialog box appears. This table describes the options and fields in the Update Alert dialog box: Option or Field Description Status Allows you to choose between the ACKNOWLEDGED and USERCLOSED statuses. Select a predefined note or enter your own Allows you to select from these options: • Alert resolved flags the alert as resolved. • False alert flags the alert as a false alarm.
2. • Click the [ Apply ] button at the bottom of the Alerts tab: Use the steps for updating multiple alerts, but select only one row to update. Related Topics “Update Multiple Alerts” (page 96) “Make Notes About an Alert” (page 96) Update Multiple Alerts You can update multiple alerts in the same operation. NOTE: You must have the necessary privileges before you can update alerts. See “Understand Privileges for Viewing and Updating Alerts” (page 88). To multiple update alert(s): 1. 2. 3. 4. 5.
4. Click the [ Apply ] button at the bottom of the Alerts tab to send the changes to the server. Related Topics “Update an Alert” (page 95) About the Console Tab When either the Alerts tab or the System Offender tab is selected in the right pane, the Console tab is visible underneath it (unless the Console tab is hidden). The Console tab shows the queries that are used to gather data-grid information from the server. You can select and copy this information directly from the tab.
8 Find Offending Processes and Queries About System Offender System Offender is a tool that allows you to monitor system resources and detect processes and queries that use excessive CPU resources or memory. These are referred to as “offending” processes and queries. System Offender is a tab within the Monitoring area of HPDM. System Offender shows real-time data about processes and queries. The data is presented in a data grid.
See the Parts of the System Offender Related Topics “Understand System Offender Privileges” (page 100) “Find Offending Processes and Queries” (page 100) Understand System Offender Privileges Administrator users (ROLE.DBA, super.services, and super.super by default) can use all System Offender features. Only administrator users can alter System Offender server parameters, use the Pstate command, and cancel queries.
NOTE: Click once; you do not need to double-click. Click any CPU bar or header for these performance metrics . . . For example –CPU Busy –Disk I/O –Cache Hits –Dispatch –Queue Length or... –Free Memory –Swap or... The System Offender tab displays a list of processes for the specified CPU (or all CPUs). The area you click in the System Monitor determines the System Offender active command. For example: When you click . . .
3. In the System Offender data grid, see a list of processes: 4. Right-click a process that you want to learn more about, and select a command from the context menu: NOTE: The Workload Detail command is active only if a query is associated with the selected process. The context menu commands provide detailed process information. For more information, see these topics.
data grid offending process Get Process Detail Information NOTE: Diagnostic information displayed by the Process Detail and Parent Process Detail dialog boxes is intended for use by HP support. This information is not documented for customer use. If you have questions about process detail information, contact your HP support representative.
Get Pstate Information NOTE: Diagnostic information displayed by the Pstate and Parent Pstate dialog boxes is intended for use by HP support. This information is not documented for customer use. If you have questions about Pstate information, contact your HP support representative.
Use the Children Processes Dialog Box To display the Children Processes dialog box, see “Get Children Process Information” (page 104). This table describes the dialog box fields: Field or Option Description Query ID The query identification number. Query Text The text of the Neoview SQL statement. Parent Process The process that spawned the children processes described in the Detailed tab. Filter CPU Value Controls which processes are displayed in the Detailed tab based on CPU utilization.
NOTE: Diagnostic information displayed by the System Offender tab is intended for use by HP support. If you have questions about an offending process, contact your HP support representative. Field Description SEGMENT The segment number. A Neoview platform consists of up to 16 segments with each segment containing up to 16 processing nodes. CPU The processing node. PIN The process identification number (PIN). The PIN is an unsigned integer that identifies a process in a processing node.
Field Description QUERY NAME The name of the client workstation and application that generated the query. QUERY TEXT A preview of the actual query text (up to 254 characters). ROLE NAME* The role of the user who initiated the query. USER NAME* The user who initiated the query. DATASOURCE The data source. *This field is not displayed by default on the data grid. To display this field, use the Show/Hide Grid Columns command available from the System Offender context menu.
NOTE: Diagnostic information displayed by the Workload Detail dialog box is intended for use by HP support. If you have questions about query diagnostic information, contact your HP support representative. The Workload Detail dialog box is mostly informational. If a query has a rule or service level associated with it, the Warn Level indicator indicates if the rule has been violated.
NOTE: You can also cancel a query from the SQL Whiteboard. See “Cancel a Query From the SQL Whiteboard” (page 119). Related Topics “Get Query Workload Information” (page 107) “Use the Workload Detail Dialog Box” (page 107) Terms administrator Alter System Offender Parameters To display the Alter Offender Parameters dialog box and alter the parameters: 1. 2. Display the System Offender tab, as described in “Display the System Offender Tab” (page 99).
Related Topics “Alter System Offender Parameters” (page 109) Control the Refresh of System Offender The System Offender data grid is refreshed automatically every 60 seconds. During a refresh, System Offender fetches new information from the server using the current active command. The active command appears under the System Offender tab. For example: A refresh timer controls the refresh interval. When an update is in progress, the refresh timer is paused.
2. Click the [ Set Refresh Time ] button: 3. Select a refresh interval. The timer status bar counts down the new refresh interval in seconds. Suppose the refresh timer is set to a low value (for example, 30 seconds). If you are investigating an offending process, you might want to pause the timer so that a refresh doesn't change the data displayed in the data grid. To pause the refresh: 1. 2. 3. Display the System Offender tab, as described in “Display the System Offender Tab” (page 99).
To erase the history, click [ Clear ]. To update the history, click [ Refresh ].
9 Work With Data Grids About Data Grids The Alerts tab, System Offender tab, SQL Whiteboard Statement Details pane, and some Space Management panels, such as the Over Threshold Summary, display information in a data grid. The data grid is a simple table with columns and some special features for displaying and manipulating data. Data grids allow you to do some or all of these tasks: • • • • • • • Get details about a specific cell or row.
The Row Details dialog box displays all possible column information, whereas the data grid shows only the grid columns that are currently configured using the Show/Hide Grid Columns command.
• To copy the data in noncontiguous cells, hold down the Control key, and select the cells you want to copy. Then right-click, and select Copy: The cell values are loaded into the Windows clipboard, from which you can paste them into other Windows applications.
Customize the Data Grid The columns in data grids are fully customizable: To Do this Show or hide columns 1. Right-click a column heading in any data grid, and select Show/Hide Grid Columns. The Show/Hide Grid Columns dialog box appears. 2. Select the columns that you want to display, and click [ OK ]. NOTE: Change the order of displayed columns Click [ Defaults ] at any time to restore the default column selections.
10 Use the SQL Whiteboard About the SQL Whiteboard The SQL Whiteboard allows you to enter and execute SQL statements from within HPDM and provides execution information for each of the SQL statements. The list of SQL statements is persisted between HPDM sessions the same way that system configuration and favorites are persisted in HPDM. Currently, HPDM supports only one instance of the SQL Whiteboard. SQL statements can be parameterized by embedding parameter names surrounded by double dollar signs ($$).
Learn About the Statement List Pane The Statement List pane provides a list of SQL statements that you added in a current session or earlier sessions of the SQL Whiteboard tool. The list of SQL statements is persisted between HPDM sessions the same way that connection information and favorites are persisted. From the Statement List pane, you can: • • • View the name and statement that was previously added in the Statement pane.
Understand Parameter Prompts SQL statements can be parameterized by embedding parameter names surrounded by $$ (double dollar signs). When the statement is executed, the SQL Whiteboard prompts you for values for all parameters in that statement and easily allows you to re-use recent values for those parameters. The feature is compatible with Neoview Reports.
Tab Description Execution Parameters Is present if the statement has parameters and shows the values chosen for the current or earlier execution. Executed Statement Displays the statement that was executed with the parameters (if any), replaced with their values. NOTE: The Execution Results tab employs a data grid that provides special features for displaying and manipulating tabular information. See “Work With Data Grids” (page 113).
To explicitly persist the layout, use the File > Save Persistence command. The layout is persisted automatically when the SQL Whiteboard exits. The next time the SQL Whiteboard is launched (either in the current instance of HPDM or in a restarted HPDM instance), the layout is restored.
11 Launch the Neoview Command Interface (NCI) Learn About NCI The Neoview platform supports a client-based utility, Neoview Command Interface (NCI), which enables you to enter SQL statements interactively or from script files in its command-line interface. You can also pass an SQL statement to NCI from a Perl or Python command line or from a Perl or Python program. For more information about using NCI, see the Neoview Command Interface (NCI) Guide, or use the command-line help within NCI.
12 Manage Disk Space About Space Management Space Management is a new area within HPDM that enables the monitoring and display of SQL space-related data for the Neoview platform. The displayed space data includes six panels of detailed SQL-space usage statistics. Space Management allows you to display SQL space by user, by schema, by table, and by partition. It also helps you identify and react to fast-growing tables by looking at historical trends.
4. In the right pane, click the Monitoring tab. After successful logon to a Neoview system: • • • • • • Space references are verified. Last inventory information is retrieved. The Over Threshold Summary is fetched. The System Overall and System Detail panels are automatically populated. The SQL Objects and SQL Objects Detail panels are populated when you by double-click an area of the pie chart or select a row in the System Detail panel.
are reported on, and then selectively view each in the graph. Space Management employs a color scheme to display each metric and its performance. Each panel in the Monitoring tab can be enlarged by clicking the box icon on the right of the heading. When the display is focused on one panel, you can no longer view information from the other panels. To return to the full system view, click the box icon again. At the top of the Monitoring tab, connection information and last inventory status are displayed.
Panel Description Partition Distribution Across Disks Bar graph view of the partition distribution across all disks in the system in megabytes (MB). Table Growth Timeline view of the object sizes by table and the top fastest growing tables in the system. Related Topics “About the Monitoring Tab” (page 128) Get Version and Build Information for Space Management Version and build information for Space Management appears in the About box. To access the About box, select the Help > About menu in HPDM .
View the Over Threshold Summary The Over Threshold Summary bar instantly allows you to identify if any disks, tables, or partitions are reaching a specified threshold level. Only entries that meet threshold criteria are displayed.
Field Description Object Name Displays the disk name, table name, or partition name. %Full Fetches details from a Neoview Repository view: NEO.HP_METRICS.DISK_STATS_V1.FULL_PCT. %User Full Displays the percentage of user full. Percent values are computed according to the total user space, which is always less than the total platform space. HP uses some space for swap files, scratch space, and other support functions.
Button Function [ Data to Spreadsheet ] Opens the Excel application and displays the data. See “Export Data” (page 36). [ Data to File ] Exports the data to a file in CSV format. See “Export Data” (page 36). View the System Overall The System Overall panel is a pie chart that is automatically populated and displays the amount of SQL space used on the Neoview by Category, by Schema, by Table, or by User. From the Space Management area: 1. Select a system you want to view details about. 2.
In the System Overall panel, these fields can be selected in the drop-down box: Field or Option Description Type Select the type of information to be retrieved. The type values are: CATEGORY, SCHEMA, TABLE, or USER. (User is a role and is not associated with an LDAP user). Count Select the maximum number of areas to be displayed. The maximum count value is 1000. Others Captures the categories that do not make the top 10 (if the count is set to 10). You can select or deselect this check box.
To activate the System Detail panel, you can either: 1. 2. Select a row in the data grid and click [ Refresh ] to refresh the panel by re-fetching the space information for the specified schema. Double-click a row in the data grid. If you click the Filter Settings bar, you can: • Select the columns to be displayed in the data grid. • Select the partition types to be displayed (partition and non-partitioned). • Enter the maximum number of rows to be viewed.
To change the sort order of a displayed column: • Click the title of the column that you want to sort in ascending or descending order. See “Sort and Move Data Columns” (page 35). • For more information on customizing the data grid, see “Customize the Data Grid” (page 116). In the System Detail panel, these fields are displayed: Field or Option Description Date Time The last time space data was captured. Catalog Displays the catalog name of the schema. Schema Displays the SQL schema name.
Button Function [ Data to Spreadsheet ] Opens the Excel application and displays the data. See “Export Data” (page 36). [ Data to File ] Exports the data to a file in CSV format. See “Export Data” (page 36). View SQL Objects The SQL Objects panel is a bar graph view of the SQL objects in the schema. The SQL objects are viewed largest to smallest. Objects limited in size are not represented in the bar graph. The title of the bar graph represents the name of the schema. From the Space Management area: 1.
NOTE: The name and size of the object appears whenever you place your cursor on a bar in the graph. In the SQL Objects panel, these fields can be selected in the drop-down box: Field or Option Description Type Specifies type as: base table (BT), materialized view (MV), index (IX), or ALL. The ALL option displays all objects. Count Specifies the number of objects to be displayed. View the SQL Objects Detail The SQL Objects Detail panel is a data grid of the SQL objects within a schema.
This figure shows a view of the SQL Objects Detail panel: If you click the Filter Settings bar, you can: • Select the columns to be displayed in the data grid. • Enter the maximum number of rows to be viewed, default is 100000. NOTE: In the filter options, the object name is required.
To change the sort order of a displayed column: • Click the title of the column that you want to sort in ascending or descending order. See “Sort and Move Data Columns” (page 35). • For more information on customizing the data grid, see “Customize the Data Grid” (page 116). In the SQL Objects Detail panel, these fields are displayed: 138 Field or Option Description Date Time The last time space data was captured. Catalog Specifies the SQL catalog name. Schema Displays the SQL schema name.
Field or Option Description Stats Row Count: Number of rows from the histogram (accuracy depends on when statistics was last updated). %Full Indicates the full size of the object. The buttons across the bottom of the SQL Objects Detail panel allow you to export data. Button Function [ Data to Clipboard ] Copies the table data to the Windows clipboard. See “Export Data” (page 36). [ Data to Browser ] Opens a browser to display the data in a tabular format. See “Export Data” (page 36).
In the Partition Distribution Across Disks panel, you can: 1. 2. 3. Select a value for Count in the drop-down box. Select a value for Delta from AVG in the drop-down box. Click [ Refresh ] to refresh the panel by re-fetching the partition distribution. In the Partition Distribution Across Disks panel, these fields can be selected in the drop-down box: Field or Option Description Count Specifies the maximum number of partitions displayed.
3. To activate the Table Growth panel, you can either: • Double-click a bar in the graph of the SQL Objects panel • Double-click a row in the SQL Objects Detail panel 4. To enlarge the view of the Table Growth panel, click the box icon on the right of the heading. When the display is focused on one panel, you can no longer view information from the other panels. To return to the full system view, click on the box icon again.
1. Select a date range for the graph using the drop-down boxes. By default, the By Table data grid fetches table details for the last quarter. You can also select other time range options: • Custom Range • Last day • Last week • Last month • Last quarter • Last year 2. Click [ Refresh ] to refresh the panel by re-fetching table growth information. The bar graph color communicates table growth: Color Description Red Indicates the minimum and maximum table growth.
Top Fastest Growing Tables Tab The Top Fastest Growing Tables tab allows you to view the top fastest growing tables (in bytes per second) and specify a date interval for which data is fetched. This figure shows a snapshot of the Top Fastest Growing Tables tab which displays the object sizes for a table named T100K during a custom selected time range: 1. Select a date range for the graph using the drop-down boxes.
Field or Option Description Object Name Space Specifies the object name space as: • CN—Constraint • IX—Index • LK—Lock • TA—Table value object (table, view, stored procedure, SQL/MP alias) • TR—Trigger • TT—Trigger temp table Object Name Specifies the SQL object name. Start Size The object size corresponds to the start time (or close to the start time), in megabytes (MB). End Size The object size corresponds to the endme (or close to the end time), in megabytes (MB).
About the General Tab The General tab includes group: • “Inventory Control ” (page 145) • “Inventory Process Detail Status” (page 147) Inventory Control The Inventory Control group allows you to define the inventory criteria to be displayed: Field or Option Description EXCLUDE Use the EXCLUDE check box to exclude full inventory of a catalog, schema, or object in the inventory criteria. Deselecting the EXCLUDE check box allows full inventory of that object to be displayed.
Field or Option Description [ Resume ] Resumes the inventory. [ Stop ] Stops the inventory. [ Status ] Obtains status and displays the progress at the bottom of the screen. In the Others area, you can configure these settings: Field or Option Description Space Reference Settings Displays a window that specifies the locations of the space references. These references are verified at startup after log on.
The references are verified upon startup after initial logon and also verified each time you switch to another already connected system. If any of the references specified cannot be found, a dialog box displays a warning, but the Space Management client continues to run. If tables are missing, you run into multiple SQL errors upon refresh of the schema.
Inventory Options In the Inventory Options group, these options can be selected in the drop-down box: Field or Option Description Process Count Number of parallel processes used for inventory. Config Rate An internal pacing value keeping inventory from using too many system resources. Update Space Reference Tables In the Update Space Reference Tables group, these tabs can be selected: Tab Description Snapshot Periods Table Exposes the table that controls space data aging and aggregation.
About Space Management Tracing Options The Space Management Options dialog box shows tracing controls for Space Management. These tracing controls are for HP support use only.
Glossary active command A command used by the System Offender to query the database (for example, STATUS CPU PROCESS ALL) for offending processes. The active command appears underneath the System Offender tab. The active command changes depending on the area you click in the System Monitor. For more information, see “Find Offending Processes and Queries” (page 100) and “Control the Refresh of System Offender” (page 110). Admin_Load_ DataSource One of two default data sources for the Neoview platform.
My Other Systems The group of Neoview platforms that are defined but not currently connected. For more information, see “Understand My Other Systems ” (page 28). Contrast with My Active Systems. navigation tree pane The left pane of the HP Database Manager interface that displays a tree of the database objects in a hierarchical form. “See the Parts of the HPDM Interface” (page 25) shows the navigation tree pane.
Index Symbols 100% settings, 83 21034, event message, 40 21035, event message, 41 A About box, 33, 128 ACKNOWLEDGED value, alerts, 95 Active command defined, 151 System Monitor effect on, 101 where displayed, 110 Active system status alerts, 83 Add System dialog box, 21 Admin_Load_DataSource defined, 151 Administrator user, defined, 151 Advanced tab, 147 Aggregation options, 84 ALARM_CLOSED_LCT_TS, 91 ALARM_CLOSED_UTC_TS, 91 ALARM_COUNTER, 90 ALARM_CREATE_LCT_TS, 90 ALARM_CREATE_UTC_TS, 91 ALARM_EVENT_NUMB
reusing, 120 Connectivity icon, 81 Console history, clearing, 97 Console tab description of, 97 showing and hiding, 97 Copy command, 114 CPU, 106 CPU Busy, 78 CPU USAGE PERCENT, 106 CPU-down color, 84 Events, viewing, 40 Exiting HPDM, 15 Export Persistence command, 15 Exporting data csv format, 36 data to browser, 37 data to clipboard, 36 data to file, 36 data to spreadsheet, 37 html format, 36 D Favorite adding to a folder, 31 creating, 31 creating a folder for, 31 defined, 151 removing, 32 removing a f
I Import Persistence command, 15 Information, new and changed, 9 Installation downloading installer, 14 instructions, 14 requirements, 14 IR_DELIVERED_LCT_TS, 91 IR_DELIVERED_UTC_TS, 91 IR_DETECTED_LCT_TS, 91 IR_DETECTED_UTC_TS, 91 IR_ID, 90 IR_LAST_UPDATE_LCT_TS, 91 IR_LAST_UPDATE_UTC_TS, 91 IR_NOTES, 91 IR_SEGMENT, 91 IR_SEVERITY, 90 IR_STATUS, 91 L Last update time, 38 LEVEL, 90 Load SQL Statement command, 120 Lock command, 120 Logging on and off, 19 Logical Space tab, 129 Lost Connection Background Col
O ODBC connection, testing, 23 ODBC driver requirement, 14 Offending processes about, 99 defined, 152 Online help build date, 9 OS requirement, 14 P Parameters tab, procedures, 69 Parent button, 29 PARENT CPU, 106 PARENT PIN, 106 PARENT PROCESS NAME, 106 PARENT PROCESS PRIORITY, 106 PARENT PROCESS TYPE, 106 PARENT PROGRAM NAME, 106 Parent Pstate command, 104 Parent Pstate dialog box, 104 PARENT SEGMENT, 106 Partitions tab materialized view indexes, 65 materialized views, 62 table indexes, 57 tables, 53 Pas
Schema, default Add System dialog box, 21 Edit System dialog box, 18 Schemas attributes tab, 48 DDL tab, 49 displaying, 47 materialized view groups tab, 48 materialized views tab, 48 privileges tab, 50 procedures tab, 49 size information, 50 synonyms tab, 49 tables tab, 48 view tab, 49 Searching, alerts, 116 SEGMENT, 106 Segment aggregation, 84 defined, 152 Separators segment, 77 showing, 84 Shortcut desktop, 14 favorite, defined, 151 keyboard, 37 navigational, 30 Show Separators option, 84 Show/Hide Grid C
active command, 110 altering parameters for, 109 context menu, 102 controlling refresh of, 110 data grid, example, 101 data grid, searching, 116 defined, 152 description of, 99 history, 111 parts of, 100 privileges for using, 100 tab, displaying, 99 System status icons details, 81 understanding, 80 System status location, 83 Systems Tool defined, 152 options, 20 overview, 19 using, 19 T Table indexes attributes tab, 53 columns tab, 56 DDL tab, 57 display table indexes summary, 57 displaying, 55 partitions