900 Series HP 3000 Computers HP Symbolic Debugger/iX User's Guide ABCDE HP Part No. 31508-90003 Printed in U.S.A.
The information contained in this document is subject to change without notice. HEWLETT-PACKARD MAKES NO WARRANTY OF ANY KIND WITH REGARD TO THIS MATERIAL, INCLUDING, BUT NOT LIMITED TO, THE IMPLIED WARRANTIES OF MERCHANTABILITY AND FITNESS FOR A PARTICULAR PURPOSE. Hewlett-Packard shall not be liable for errors contained herein or for incidental or consequential damages in connection with the furnishing, performance or use of this material.
Print History The following table lists the printings of this document, together with the respective release dates for each edition. Many product releases do not require changes to the document. Therefore, do not expect a one-to-one correspondence between product releases and document editions.
. iv
Preface The HP Symbolic Debugger/iX User's Guide explains how to debug computer programs on 900 Series HP 3000 computer systems. The manual assumes that you are an experienced programmer familiar with symbolic debuggers on other systems. This manual contains the following chapters: Chapter 1 Introduces the HP Symbolic Debugger/iX - what it is and who can use it. This chapter also explains how to prepare a program for use with the symbolic debugger.
Additional Documentation This manual does not discuss the MPE/iX operating system in detail. Only those aspects relevant to HP Symbolic Debugger are mentioned. Similarly, details about compiling a program using HP COBOL II, HP FORTRAN 77, HP Pascal, and HP C are only discussed to the extent that they a ect how you use HP Symbolic Debugger. See the appropriate operating system or language manual for complete information about those subjects.
Conventions In a syntax statement, commands and keywords are shown in uppercase and lowercase characters. The characters must be entered in the order shown; however, you can enter the characters in either uppercase or lowercase.
Conventions [ ] (continued) In a syntax statement, brackets enclose optional elements. In the following example, ,TEMP can be omitted: PURGE lename[,TEMP] When several elements are stacked within brackets, you can select one or none of the elements. In the following example, you can select devicename or deviceclass or neither. The elements cannot be repeated. devicename SHOWDEV deviceclass [ . ..
SET [(modi er)]1(variable); 4 5 5indicates a key on the The symbol 4 keyboard. For example, 4RETURN5 represents the carriage return key.
Conventions 4CNTL5char (continued) Comment > j ; base pre xes 4CNTL5char indicates a control character. For example, 4CNTL5Y means you press the control key and the Y key simultaneously. Explains an operator entry or debug message. The HP Symbolic Debugger prompt. Represents \or". Separates commands in a command list.
Contents 1. Introducing HP Symbolic Debugger/iX Who Can Use HP Symbolic Debugger . . . . . Creating a Program with Debugger Information Terminal Support . . . . . . . . . . . . . Command History . . . . . . . . . . . . . Where To Go from Here . . . . . . . . . . . . . . . . . . . . . 1-2 1-3 1-4 1-5 1-6 2. Getting Started The Debugger Session Scenario . . . Running the Sample Session . . . . Where To Go from Here . . . . . . Sample Program Listings . . . . . Sample HP COBOL II Program .
Using Macros . . . . . . . . . . . . . . . . . Altering the Execution Sequence . . . . . . . . . Getting Help . . . . . . . . . . . . . . . . . . 4. HP Symbolic Debugger Commands Entering Commands . . . . . . . . . . . . Using Uppercase and Lowercase . . . . . . Abbreviating Commands . . . . . . . . . Entering Variable Names . . . . . . . . . Entering Expressions . . . . . . . . . . . Entering Procedure Calls . . . . . . . . . Window Mode Commands . . . . . . . . File Viewing Commands . . . . . . . . .
D. HP Pascal Language Operators HP Pascal Language Operators . . . . . . . . . . HP Pascal Language Operators . . . . . . . . . D-1 D-2 E. HP COBOL II Language Operators HP COBOL II Language Operators Dereferencing Operations . . . Field Dereferencing . . . . . Array Dereferencing . . . . . . . . E-1 E-2 E-2 E-3 F. Special Variables Used by the Symbolic Debugger Special Variables . . . . . . . . . . . . . . . . F-1 G. Limitations and Hints Limitations and Hints . . . . . . . . . . . . . . G-1 H.
Figures 1-1. 2-1. 2-2. 2-3. 2-4. 2-5. 2-5. 2-6. 2-6. 3-1. 3-2. Creating an Executable Program File . . . . . . Sample Debugger Session Scenario . . . . . . . HP COBOL II Main Source File, DEMOCBMS . HP COBOL II Subroutine Source File, DEMOCBSS HP FORTRAN 77 Main Source File, DEMOFS . HP Pascal Main Source File, DEMOPS . . . . . Pascal Main Source File, DEMOPS (Continued) . C Main Source File, DEMOCS . . . . . . . . . C Main Source File, DEMOCS (Continued) . . .
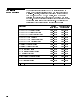
Tables 3-1. 4-1. 4-2. 4-3. 4-4. 4-5. 4-6. B-1. C-1. D-1. E-1. F-1. I-1. I-2. I-3. I-4. I-5. I-6. I-7. I-8. I-9. I-10. I-11. I-12. I-13. I-14. I-15. I-16. I-17. I-18. I-19. Compiler Embedded and Info-string Options . Escape Sequences . . . . . . . . . . . . . Symbolic Constants . . . . . . . . . . . . Data Viewing Formats . . . . . . . . . . Shorthand Notation for Size . . . . . . . . Record and Playback Commands . . . . . . Commands Used to Record Debugger Output Language Operators for HP C . . . . . . .
1 Introducing HP Symbolic Debugger/iX The HP Symbolic Debugger is an interactive tool that assists you in nding errors in programs written in high-level programming languages. On most terminals, the HP Symbolic Debugger uses the full screen. The screen is divided into areas that let you view source code, commands that you enter and command and program output. When you work with the debugger, you use the same language constructs that are used in the program you're debugging.
Who Can Use HP Symbolic Debugger 1-2 HP Symbolic Debugger can be used by programmers who program in HP COBOL II, HP C, HP Pascal, and HP FORTRAN 77.
Creating a Program with Debugger Information To debug a program on the symbolic level, you must compile and link the source program with debugger information to create an executable program le. Figure 1-1 illustrates the process of creating an executable program le containing debugger information. If you do not compile and link your program with debugger information, the debugger can only display the register values, absolute addresses, and labels. Figure 1-1.
Terminal Support 1-4 Only Hewlett-Packard terminals with memory lock support the command windows used by the debugger. Non|Hewlett-Packard terminals or Hewlett-Packard terminals without memory lock operate in line mode only. Use the -L command line option when invoking the debugger to operate in line mode.
Command History The symbolic debugger has a command history mechanism modeled after MPE/iX's command interpreter. The symbolic debugger recognizes the following history commands: do redo listredo The di erences between MPE/iX's command interpreter and the symbolic debugger's command history mechanism are as follows: The symbolic debugger has a default redo stack size of 20.
Where To Go from Here You are now familiar with the major features of HP Symbolic Debugger. To get hands-on practice in running the debugger, continue on with the next chapter. It tells you how to run a sample debugger session. If you don't have time to run the sample session, but want to start debugging a program right away, skip to chapter 3. Chapter 3 introduces you to the most common ways to use the debugger and should give you enough information to begin using it. Use chapter 4 as a reference chapter.
2 Getting Started HP Symbolic Debugger/iX comes with a sample debugger session for each of the supported native mode languages, HP COBOL II, HP FORTRAN 77, HP Pascal, and HP C. You can run it without knowing anything about the debugger; the debugger guides you through each step. The session takes only a few minutes to run. When you're nished, you will have a good overview of how the debugger works and some important ways it can be used.
The Debugger Session Scenario The following explains the scenario under which the sample debugger session runs. You're developing a program to read and process rainfall data. Proceeding in stages, you're developing the user input section and the portion that lls in an array with data from the rainfall le. During tests, you've encountered program aborts with messages indicating that access to memory outside your program's allotment has occurred.
Running the Sample Session To run the sample debugger session, log on to your account. Then enter the command below that corresponds to the language you're most familiar with: HP COBOL II|> xdb;info="-d pub.sys HP FORTRAN 77|> HP Pascal|> HP C|> democbx.pub.sys" xdb;info="-d pub.sys demofx.pub.sys" xdb;info="-d pub.sys demopx.pub.sys" xdb;info="-d pub.sys democx.pub.sys" This will get you inside HP Symbolic Debugger. You used the -d option to specify the directory where the source le is.
Where To Go from Here 2-4 Getting Started Now that you've completed the sample session, you have a good idea about how HP Symbolic Debugger works. To learn more details about the operations used in the debugger session or to begin debugging your own programs, continue with chapter 3. If you want to see the listing for the program you saw in the session, read on.
Sample Program Listings This section lists the language source les used in the sample debugger sessions on line.
Sample HP COBOL II Program $CONTROL BOUNDS, VERBS, MAP, CROSSREF IDENTIFICATION DIVISION. PROGRAM-ID. RAIN-REPORT. ENVIRONMENT DIVISION. DATA DIVISION. WORKING-STORAGE SECTION. 77 NUMBER-YEARS PIC 9. 77 FIRST-YEAR PIC 9(4). 01 YEAR-INDEX PIC 9(4) COMP. 01 NUM-OF-MONTHS PIC 9(4) COMP. 01 MONTH-TOTALS VALUE ZEROS. 05 MT-TABLE PIC 9(6)V99 OCCURS 60 TIMES. PROCEDURE DIVISION. 100-MAIN-ROUTINE. PERFORM 200-GET-INPUT. PERFORM 300-CALCULATE. PERFORM 400-PRINT-REPORT. PERFORM 500-STOP-RUN. 200-GET-INPUT.
Sample HP COBOL II Program $CONTROL SUBPROGRAM, BOUNDS, VERBS, MAP, CROSSREF IDENTIFICATION DIVISION. PROGRAM-ID. LOADMT. AUTHOR. ANON. ENVIRONMENT DIVISION. INPUT-OUTPUT SECTION. FILE-CONTROL. SELECT RAINFILE ASSIGN TO "RAINFALL.pub.sys". DATA DIVISION. FILE SECTION. FD RAINFILE. 01 INCHES-PER-MONTH PIC 9(6)V99. WORKING-STORAGE SECTION. 77 77-INDEX PIC S9(4) COMP. LINKAGE SECTION. 01 YEAR-INDEX PIC 9(4) COMP. 01 NUM-OF-MONTHS PIC 9(4) COMP. 01 MONTH-TOTALS. 05 MT-TABLE PIC 9(6)V99 COMP OCCURS 60 TIMES.
Sample HP FORTRAN 77 Program $CONTROL RANGE, CODE_OFFSETS, TABLES PROGRAM RAIN_REPORT INTEGER*2 NUMBER_YEARS, 2 FIRST_YEAR, 3 YEAR_INDEX, 4 NUM_OF_MONTHS REAL MONTH_TOTALS(60) 100 PRINT *,'ENTER THE FIRST YEAR YOU WISH TO REPORT ON: ' READ (5,*) FIRST_YEAR IF ((FIRST_YEAR .LT. 1950).OR.(FIRST_YEAR .GT. 1988)) THEN GOTO 100 ENDIF 110 PRINT *,'ENTER THE # OF YEARS YOU WISH TO CONSIDER (1-5): ' READ (5,*) NUMBER_YEARS IF ((NUMBER_YEARS .LT. 1).OR.(NUMBER_YEARS .GT.
Sample HP Pascal Program $RANGE ON, CODE_OFFSETS ON, TABLES ON$ program RainReport (INPUT, OUTPUT, RainFall); type YearType NumYearsType MonthTotalType ArrayType var NumYears FirstYear YearIndex NumOfMonths MonthTable RainFall : : : : : : = = = = 1900..2000; 0..200; REAL; ARRAY [1..60] of MonthTotalType; NumYearsType; YearType; INTEGER; INTEGER; ArrayType; TEXT; procedure GetInput; { This procedure prompts the user for the initial year and number of years for the report.
procedure GetNumYears; begin {procedure GetNumYears statements}; writeln (OUTPUT); prompt (OUTPUT, NumYearsPrompt); readln (INPUT, NumYears); IF (NumYears < 1) or (NumYears > 5) THEN GetNumYears; end; begin {level 1 procedure}; GetFirstYear; GetNumYears; YearIndex := (FirstYear - 1950) * 12; NumOfMonths := NumYears * 122; end {level 1 procedure}; procedure LoadMonthTable; var ArrayIndex : INTEGER; HoldRainFall : INTEGER; begin {LoadMonthTable statements}; HoldRainFall := 0; reset (RainFall, 'RAINFALL.pub.
Sample HP C Program #include
void get_input() { /* * This function prompts the user for the initial year and number of * years for the report. It also checks to see that the year and number * of years are within range. */ get_first_year(); get_num_years(); year_index = (first_year - 1950) * 12; num_of_months = num_years * 122; } void load_month_table() { int array_index; int hold_rain_fall = 0; } rain_fall = fopen("RAINFALL.pub.sys", "r"); /* This loop will perform dummy reads to get the file to the start * of the requested data.
3 Using the HP Symbolic Debugger This chapter shows you how to start HP Symbolic debugger and how to use its major features. The rst sections of the chapter list the steps you must perform to begin using the debugger and familiarize you with the screen display. The last sections of the chapter show you how to perform various tasks. You do not perform these tasks necessarily in the same order as they are listed; pick and choose the tasks depending on your requirements.
Preparing the Program Before starting HP Symbolic Debugger, compile your HP COBOL II, HP FORTRAN 77, HP Pascal, or HP C program using the symbolic debugger option. If you do not use the symbolic debugger option, you can only debug the program in disassembly mode; the debugger can track only register values, absolute addresses and labels. When you're con dent that the program will compile without errors, use the symbolic debugger compile option.
For HP COBOL II programs only, HP Symbolic Debugger uses the listing le cobxdb rather than the source les for the source viewing inside the debugger. Therefore, when you are debugging HP COBOL II programs derived from more than one source le, you must equate the default listing le cobxdb to a permanent listing le name before you compile each source le. You do not link the listing les with the object les. For example, suppose you have an HP COBOL II program comprised of the source les cob1 and cob2 .
Starting the HP Symbolic Debugger When using HP Symbolic Debugger, the debugger is the parent process and the program that you're debugging becomes a child process. The debugger controls only the child process and can debug only one child process at a time. You can use HP Symbolic Debugger with sharable code, but you should be the only person using it at one time. (If someone else is using it also, they will encounter the same breakpoints, for example.
-d group.[acct ] -p le -r le -L -S num object le This option names an alternate group and (optional) account containing the source les used to create the object le . Group and accounts are searched in the order that you list them. The current group and account is used if the le is not found in the group and account that you enter here. You can enter more than one -d option. This option names a playback le created in a previous debugger session (see the -r option) or one that you created yourself.
Note Once You Start HP Symbolic Debugger . . . Equivalent debugger commands exist for the -d , -p , and -r options. See the dir (directory ) and the \Record and Playback Commands" section in chapter 4, HP Symbolic Debugger Commands. When you start HP Symbolic Debugger from a terminal that supports windowing, you see a source window similar to the one shown in Figure 3-1.
The screen has three parts, which are described below. This is the screen you see when debugging in symbolic (source ) mode. Source window The source window is located at the top of the screen, above the highlighted line. This is the area where you view the source statements. If your terminal has 24 lines, the top 15 are used for the source window. To alter the number of lines in the source window, see the section \Changing the Source Window Size" in this chapter.
in any particular order. You need to determine which are relevant to the debugging session at hand and perform only those.
Starting the Program Once you start the debugger and you are ready to begin debugging your program, enter either an r (run ), R (Run ), s (step ) or S (Step ) command. The r (run ) command starts execution of the program and allows you to enter arguments with it. The R (Run ) command, as shown below, starts executing the program, but does not allow you to enter run-time arguments: >R To execute one statement (or one step of a Pascal statement) at a time, enter either the s (step ) or S (Step ) command.
Ending the Program If you want to terminate your program before it normally completes, enter the k (kill ) command: >k You will be prompted to con rm this request. To have the debugger ignore the request, enter n; otherwise, enter y. At this time, you can restart the program, quit the debugger, or enter other commands.
Ending the HP Symbolic Debugger To end HP Symbolic Debugger, enter the q (quit ) command: >q You will be prompted to con rm this request. To have the debugger ignore the request, enter n; otherwise, enter y.
Displaying Lines in the Program There are several ways to display program lines in the source program window. To display a particular source line, enter the v (view ) command with the line number. For example, to display line 11: >v 11 To move one or more lines forward in the program, enter the plus sign (+ ) and the number of lines you want to move. When moving forward or backward in the program, the source and location windows are adjusted accordingly.
Controlling the Command Window Display Command and program output is displayed one screen at a time in the command window. You can use the terminal keys PgUp , PgDn , Home , End and the 4CTRL5arrow keys (or the equivalent scroll keys on your terminal) to scroll the command window. When you enter a command that requires more than the number of lines in the command window to display, the debugger displays enough lines to ll the command window then displays --More--at the bottom.
Changing the Source Window Size To change the size of the source window, use the w (window ) command and specify the number of lines you want for this window. For example, to change the size of the source window to 12 lines enter: >w 12 The number of lines for the source window range from one to 21 for a 24-line terminal (the default is 15). Changing the size of the source window also changes the size of the command window.
Displaying Assembly Code If you didn't use the symbolic debugger option when compiling the program, you will be debugging in disassembly mode and will see a screen similar to the one shown in Figure 3-2. Even if you compiled with the symbolic debugger option, you can debug in disassembly mode by entering the td (toggle disassembly ) command as follows: >td In disassembly mode, the program is debuggable at the machine instruction level.
To return to source mode, enter td again. Disassembly mode can also be used when only parts of your program were compiled with the symbolic debugger option. Libraries linked in with your program are generally not debuggable unless disassembly mode is used, regardless of whether your program was compiled with the symbolic debugger option. Refer to appendix F \Registers Displayed by HP Symbolic Debugger" to see the registers displayed by the debugger in disassembly mode.
Displaying Source and Assembly Code To view both the source code and its matching assembly code, enter the ts (toggle screen ) command. When you do this, the source window is divided into two windows, the top for source code and the bottom for assembly code as shown in Figure 3-3. To view source and assembly code, enter: >ts Figure 3-3. The HP Symbolic Debugger Screen (Source and Disassembly Mode) To return to source mode, enter ts again.
Stepping through the Program The debugger lets you step through a program one (or more) statements at a time. If you're in disassembly mode, you execute one or more machine instructions; if you're in source mode, you execute one or more source statements. If you're in split-screen mode, the single step mode (symbolic or assembly) is indicated on the highlighted line separating the source window from the assembly window. Stepping lets you closely examine program execution.
Searching for a String in the Current File This section explains how to locate certain text elements in the current source le. For example, you can search for array elements and pointers by name or you can search for arithmetic expressions. You can search forward or backward in the current le for any text string. When you reach the end of the current le, searching starts again at the beginning.
Pausing during Execution When you want to temporarily suspend the execution of the program to examine some aspect of it, such as a variable's value, set one or more breakpoints in the program. This must be done before starting the program, or when it is suspended by an existing breakpoint or an exception condition. Breakpoints direct the debugger to stop execution at or immediately before executing the speci ed line (or instruction).
the global variable someglobal . The c (continue) command resumes execution of the program.
You can also set all-procedure breakpoints with the bpt and the bpx commands. The bpt command sets a trace breakpoint at the beginning and exit of all procedures. The bpx command sets a breakpoint at each procedure's exit. For HP COBOL II programs, use the bpg (breakpoint paragraph ) and the tpg (trace paragraph ) commands to set all-paragraph breakpoints. The procedure and paragraph breakpoints are set for all procedures and paragraphs. You cannot set individual procedure breakpoints in this manner.
Deleting Breakpoints To delete a breakpoint, enter the debugger-assigned number of the breakpoint (see the previous section \Displaying Breakpoints") with the db (delete breakpoint ) command. For example, to delete the breakpoint whose number is 2, enter: >db 2 If you do not enter the breakpoint number, the breakpoint at the current line, if any, is deleted. If there is no breakpoint at the current line, the debugger displays all of the breakpoints.
Displaying Data Whenever program execution pauses, you can display the contents of simple variables, arrays, structures and pointers. For HP COBOL II programs, use the disp (display ) command. You can display simple items, elds, array elements, and expressions. Types of items displayed can be edited or non-edited . The following example displays the variable X : disp X For HP FORTRAN 77, HP Pascal, or HP C programs, use the p (print ) command.
To display the contents of the location that is 30 bytes ahead of the last displayed data item in memory (HP C), enter: >p *(&.+30) This assumes the speci ed location begins a data item of the same type and size.
Modifying Data When you need to alter the value of a variable, array item or pointer, use the mov (move ) command for HP COBOL II programs. The mov (move ) command requires a source and destination. The source can be any non-edited eld, a string literal, a number, a named constant (\spaces" or \blanks"), or an expressions involving any of these data elements. The destination can be any non-edited eld. The following example sets y to the value of the expression x+24 .
Tracing Function and Procedure Calls When a program contains several functions or procedure calls, you might need to know the sequence of calls that led to the current point of suspension. Displaying this sequence is called \viewing the stack". To view the stack, enter the t (trace ) command: >t 0 f2 (i = 3) [t.c: 17] 1 f1 (i = 2) [t.c: 11] 2 main () [t.c: 5] The debugger lists the current (depth 0) procedure rst.
Capturing and Rerunning a Debugger Session If, before a debugging session, you think you might need to retrace your steps, you can capture the debugger commands you used during the session. You can save the debugger commands in a le and \play them back" during a subsequent session. To write the debugger commands to a le, start the debugger using the -r option.
Executing Commands At Each Source Line When you suspect that bugs might be occurring at several places in a program, or you have a bug that is especially di cult to track down, you can direct the debugger to execute one or more commands before every source statement is executed. For example, you might want to track the value of one or more variables through a series of detailed calculations. The commands that you execute are called assertions. Assertion command lists must be enclosed in braces.
Using Macros Macros are words that represent one or more debugger commands. You create macros by entering names for them and specifying the commands for which they stand. Macros are very useful for representing a group of commands that you execute often. You do not have to re-enter the commands; just enter the macro name for them. The following command de nes the macro xyz .
Altering the Execution Sequence When the program is paused at a breakpoint or you are stepping through it, you can change the normal execution sequence of the program and cause it to resume at a di erent line. To resume execution of a program at a speci c line, use the g (goto ) command with the appropriate line number. The new line must be in the same procedure or paragraph as the current one.
Getting Help When you need help with the format of a debugger command or can't remember which command performs a particular function, use the h (help ) command as follows: >h Help text is displayed one window at a time when the more feature is activated. You can use the terminal keys PgUp , PgDn , Home , End and the 4CTRL5arrow keys (or the equivalent scroll keys on your terminal) to scroll the command window. The debugger displays enough lines to ll the command window then displays --More--at the bottom.
4 HP Symbolic Debugger Commands This chapter describes the commands recognized by the HP Symbolic Debugger. These commands are arranged by function in alphabetical order and can be entered in short form (abbreviated) or long form (spelled out). If you use the long form, space between command words is optional. Entering Commands The HP Symbolic Debugger keeps track of the current le, procedure, line and data locations of the executing program.
Using Uppercase and Lowercase 4-2 Some HP Symbolic Debugger commands are case-sensitive. The two cases are treated di erently by the debugger. For example: s or step Lowercase \s" tells the HP Symbolic Debugger to single step to the next executable statement and step into a procedure, if necessary. S or Step Uppercase \S" tells the HP Symbolic Debugger single step to the next executable statement and step over a procedure call.
Abbreviating Commands You can enter commands in their complete spelled-out form (long form) or in an abbreviated form (short form). Generally, you can abbreviate one-word commands using the rst character of the word. Abbreviate two-word commands using the rst character of each word in the command (do not leave a space between the two characters). If you use the long form, you can leave a space between words.
p $xyz = 3*4 the special variable $xyz is created and assigned the value of 12.
To view special variables (except hardware registers), use the ls (list specials ) command. There are several special variables that are available; all but user-de ned special variables are prede ned by the debugger. The special variables are: $var Represents user-de ned variables. They are of type long integer and do not take on the type of any expressions assigned to them. Hardware Registers $r0 . . . $r31 General Registers $f0 . . .
allocated by the debugger for its own use. This does not re ect memory-use of the program being debugged. $step Allows you to see and change the number of machine instructions the debugger steps through while in a non-debuggable procedure, before setting an uplevel breakpoint and free-running to it. (this is where a breakpoint is set immediately after the return location in the non-debuggable procedure's caller). This situation occurs only when the program is executing in a single step or assertion mode.
Entering Expressions An expression is a symbolic or mathematical representation. Expressions consist of variables, constants and operators, or any syntactically correct combination of these items. The HP Symbolic Debugger evaluates user expressions as if they are part of the high-level language being debugged and, therefore, uses the same operators and assignment rules as the high-level language. See Appendices B, C, D, and E for a list of operators that you can use with each language.
Table 4-1.
Expressions can also contain the symbolic constants listed in table 4-2. Table 4-2. Symbolic Constants Language Constants HP COBOL II SPACES ZEROS HP Pascal NIL MAXINT MININT TRUE FALSE HP FORTRAN 77 .TRUE. .FALSE. HP C NONE If you do not have an active child process, you can only evaluate expressions containing constants. Floating point constants must be of the form: 2 3 e 6E7 6 7 6 7 6d7 6 7 6D7 digits.
In the absence of a su x character, the constant is assumed to be of type double (8 byte IEEE real).
Expressions approximately follow the HP C language rules of promotion. In other words, char, short, and int become long and float becomes double. If either operand is a double, oating math is used. If either operand is unsigned, unsigned math is used. Otherwise, normal (integer) math is used. Results are then cast to proper destination types for assignments. If a oating point number is used with an operator that does not normally permit it, the number is cast to long and used that way.
Whenever an array variable is referenced without giving all its subscripts, the result is the address of the lowest element referenced. For example consider the following declared arrays: HP FORTRAN 77 x(5,6,7) HP Pascal x[1..5,2..6,3..
Window Mode Commands Window Mode Commands Window mode commands let you control what is displayed on the screen. The window mode commands are: fr ( oating point registers) gr (general registers) sr (special registers) td (toggle disassembly) ts (toggle screen) u (update) U (Update) w (window) The source window displays source lines in a program.
Window Mode Commands gr (general registers) gr general registers Displays the HP-PA general registers in the register window when the debugger is in disassembly mode. When the value of a register changes, that register is highlighted until after the next command. Use the debugger's special variables $r0 through $r31 (or equivalent usage names such as $arg3 ) to modify these registers.
Window Mode Commands ts (toggle screen) ts toggle screen Toggles the source window between all source or all assembly and split-screen mode. In split-screen mode, the source window displays both source code and corresponding assembly instructions. Single stepping occurs at either the source statement or the assembly instruction level, depending on the part of the split-screen in which you are single stepping. The stepping mode is displayed in the line separating the source and assembly windows.
The le viewing commands let you view program source code. The le viewing commands are: + / ? D (Directory) ld (list directories) lf (list les) L (Location) n (next) N (Next) v (view) V (View) va (view address) File Viewing Commands 2 + + number 3 Moves forward in the current le the speci ed number of lines (or the speci ed number of instructions in disassembly mode). If you do not enter a number, the next line (or instruction) becomes the current line (or instruction).
File Viewing Commands ? 2 ? string 3 Searches backward in the current le for a speci c pattern. Searches wrap around the beginning of the le. If you do not enter a string, the last search string is used again. The string must be literal; wild cards are not supported. You can select case sensitivity for string searches with the tc (toggle case ) command. Initially, searches are case insensitive.
File Viewing Commands L (Location) L Location Displays in the command window the current le, procedure, line number and the source text for the current point of execution. This command allows you to determine where you are in the program and is useful when included in an assertion or breakpoint command list. For example: >L doproc.c: eval_q: 8: if (qp != NULL) { You cannot press 4RETURN5 to repeat this command. n (next) n next Repeats the previous search (/ or ?) command.
File Viewing Commands v (view) v view 2 location 3 Displays one source window forward from the current source window. One line from the previous window is preserved for context. If your terminal does not support windowing, only the new source line is displayed. A location can be a particular line, procedure, or any text le, whether used in the program or not. For COBOL, a location can also be a paragraph or section.
File Viewing Commands va (view address) va address view address Displays in the source window assembly code at the speci ed address. A speci ed address can be an absolute address or symbolic code label with an optional o set (for example, start + 0x20). This command is used in disassembly mode only.
Data Viewing and Modification Commands Data Viewing and Modification Commands Data viewing and modi cation commands allow you to view program data in a variety of formats and change the values of variables.
Data Viewing and Modification Commands l (list) l list 2 2 proc :depth 33 Lists all parameters and local variables of the current procedure. You can optionally specify any active procedure and its depth on the stack. If a procedure name is given without a depth, then the most recent invocation of that procedure is used. If an invocation of that procedure other than the most recent is desired, then a depth must be speci ed. The following illustrates the use of this command.
Data Viewing and Modification Commands lc (list common) lc list common 2 string 3 Used when debugging an HP FORTRAN 77 program, this command displays HP FORTRAN 77 common blocks and their associated variables. If a string is speci ed, only those common blocks whose names begin with that string are printed; otherwise, all common blocks within the current subroutine or function are printed.
Data Viewing and Modification Commands Sample output is: >lm pheadtuti ==> p flavor:list->head.tutifruti unS ==> bu\t {}; c Overall macros state: ACTIVE lp (list procedures) lp list procedures 2 string 3 Lists all procedure names and their aliases as well as their locations in memory. If a string is speci ed, only those procedures whose names begin with this string are listed.
Data Viewing and Modification Commands ls (list specials) ls list specials 2 string 3 Lists all special variables and their values. Registers are not listed. If a string is speci ed, only those special variables whose names begin with this string are listed.
Data Viewing and Modification Commands p (print) 3 2 9 8 < expr ?format = p 3 + 22 3 \ format ; print : - Displays and optionally modi es program data. You can choose to display data in one of the formats shown in tables 4-3 and 4-4. The p (print ) command is also used to evaluate arbitrary expressions involving constants and/or program data.
Data Viewing and Modification Commands Many of the the data formats have a default size if the size is not given. For example, X has a default size of four bytes. There are also some shorthand notations for size . These shorthand notations are shown in table 4-4. Shorthand notations can be appended to formchar instead of a numeric size. For example: xb prints one byte in hexadecimal. There is also a default for the format, if the format is not speci ed.
Data Viewing and Modification Commands Table 4-3. Data Viewing Formats Formchar Description a Prints a string using the expression as the address of the rst byte. (b|B) Prints a byte in decimal. (c|C) Prints a character. (d|D) Prints in decimal as an integer or long integer, respectively. (e|E) Prints in e oating point notation as a oat or double, respectively. (4 bytes, 8 bytes) (f|F) Prints in f oating point notation as a oat or double, respectively.
Data Viewing and Modification Commands Use the nformat option to display the value of the expression in a speci c format. For example: >print abc\x prints the contents of abc in hexadecimal. If a format is not given, the expression is displayed in a format consistent with the type of the expression. For example: >print (abc*3/25)+2 prints the results of evaluating the given expression using the current value of abc in decimal.
Data Viewing and Modification Commands Here are some symbol table dependencies: 1. When you try to display a variable which is an HP FORTRAN 77 format label, an HP Pascal le-of-text, or an HP Pascal set, with no display format or with normal format (nn ), the value is shown as fformat-labelg, f le-of-textg, or fsetg, respectively. You can use other formats, such as nx , to display the contents of such variables. 2.
Stack Viewing Commands Stack Viewing Commands Stack viewing commands trace the stack of a program. The stack viewing commands are: t (trace) T (Trace) Figure 4-1 illustrates the stack depth of a program and shows that A called B, B called C, C called D, D called E, E called F, and program execution is currently suspended in F. The procedure at which the program is currently stopped is always at depth zero. Figure 4-1.
Stack Viewing Commands t (trace) t trace 2 depth 3 Prints a stack trace. You can optionally specify a depth . The default depth is 20 levels. If an optional depth is supplied, only the procedures up to this depth in the stack are displayed.
Stack Viewing Commands T (Trace) T Trace 2 depth 3 Prints a stack trace. You can optionally specify a depth . The default depth is 20 levels. If an optional depth is supplied, only the procedures up to this depth in the stack are displayed.
Status Viewing Command The status viewing commands display the state of the debugger and the program being debugged. Various list commands can be used. Refer to the section on Data Viewing and Modi cation for further information about list commands. The other major status viewing command is: Inquire I (Inquire) I Inquire Prints the current status of the debugger.
Job Control Commands The job control commands let you control execution of the program. The parent (HP Symbolic Debugger) and child (object le ) processes take turns running. The debugger is only active while the child process is stopped, due to encountering a signal or a breakpoint, or by terminating.
Job Control Commands r (run) r run 2 ;info='info-string' 32 ;parm='number' 3 Lets you run a program as a new child process with an optional info string and run parm . If a child process already exists, the debugger asks if you want to terminate the child process rst. If you do not enter an info string , the debugger uses those supplied with the last r (run ) command (if any). info string can contain a \<" and/or a \>" for redirecting standard input and standard output ($STDIN ) and ($STDOUT ).
Job Control Commands S (Step) S Step 2 number 3 Single steps through a program. In source mode, one source statement (or one step of a multiple step statement in HP Pascal or HP C) is executed; in disassembly mode, one machine instruction is executed (several machine instructions might be equivalent to one source statement). If a procedure call is encountered, it is not \stepped into". Instead, execution steps to the statement following the call.
Job Control Commands Breakpoint Commands 4-38 A breakpoint, when encountered, suspends the execution of the program at a particular location. HP Symbolic Debugger provides a number of commands for setting, deleting, and managing breakpoints.
Breakpoint Commands Once a breakpoint has been encountered during program execution, you can examine the program state, unless the breakpoint command list includes a command that causes the child process to continue or terminate. Examples of these commands are the c (continue ), r (run ), k (kill ) and q (quit ) commands. Individual breakpoints are identi ed by a unique number, which is assigned by the debugger. Breakpoints can be activated or deactivated (suspended) individually.
Breakpoint Commands permanent. If the count is negative, the breakpoint is temporary and is cleared when the program stops there. When you enter a new breakpoint without a count, the breakpoint is permanent and a count of 1 is used. To change the count of an existing breakpoint, use the bc (breakpoint count ) command. An alternate way to enter a breakpoint is to enter t for a temporary breakpoint and p for a permanent breakpoint. Entering a t or p by itself sets the count to -1 or 1, respectively.
Breakpoint Commands Command List Caution A command list is one or more commands that are executed when its associated breakpoint occurs. Separate commands in a command list by semicolons. Use braces fg to separate the breakpoint command list from other debugger commands on the same line. Only one active command line can exist at one time. A command line is either the sequence of commands you enter at the debugger prompt or the command list associated with a breakpoint or assertion.
Breakpoint Commands There are six basic types of single breakpoints. There can only be one type of single breakpoint at a given location in the code. Generic Set with the b (breakpoint ) command at a given source-line. Address Set with the ba (breakpoint address ) command at a given address (which might not correspond directly to a source line). Procedure or paragraph beginning (entry) Set with the bb (breakpoint beginning ) command at the rst executable statement of a procedure.
Breakpoint Commands Procedure (beginning) Procedure exit Procedure trace Set with the bp (breakpoint procedure ) command at the rst executable statement of all procedures. Set with the bpx command at the common exit point of all procedures. Set with the bpt command at the entry and exit of all procedures.
Breakpoint Commands At a given procedure entry, up to four command lists can be associated with the location: Global breakpoint command list Set with the abc command. Individual procedure beginning breakpoint command list Set with the bb (breakpoint beginning ) command. All-procedure beginning breakpoint command list Set with the bp (breakpoint procedure ) command. All-procedure trace breakpoint command list Set with the bpt command.
Breakpoint Commands There are two basic types of all-paragraph breakpoints. These may co-exist with other all-paragraph breakpoints and/or a single breakpoint at a given location. Paragraph (beginning) Set with the bpg (breakpoint paragraph ) command at the rst executable statement of all paragraphs. Paragraph trace Set with the tpg (trace paragraph ) command at the entry of all paragraphs.
Overall Breakpoint Commands lb (list breakpoints) lb list breakpoints Displays all breakpoints in the program, both active and suspended, and the overall breakpoint state. The display shows the number, count, status and commands for each breakpoint. Figure 4-2 gives an example of the information that is displayed for a typical breakpoint. This information is also displayed whenever a breakpoint is added or deleted. Figure 4-2.
Overall Breakpoint Commands tb (toggle breakpoints) tb toggle breakpoints Toggles the overall breakpoint state from active to suspended or vice versa. The state of the individual breakpoints remains unchanged.
Breakpoint Creation Commands b (breakpoint) b breakpoint 2 location 32 \count 32 command-list 3 Sets a breakpoint at the location that you specify. If you do not enter a location, the current line in the source window is used. The breakpoint is executed on each occurrence (count) that you specify. You can enter a list of commands to be executed at the breakpoint by entering the command list. The command list will be executed when the breakpoint is reached and its count is zero.
Breakpoint Creation Commands The following is an example: >ba printf+0x0018 Overall breakpoints state: ACTIVE Added: 2: count: 1 Active printf +0x00000018: (line unknown) Caution Be sure the address given in the ba (breakpoint address ) command is a code address in the child process or errors might ensue.
Breakpoint Creation Commands To enter a di erent command list for the exit point of the procedure or subprogram, use the bx (breakpoint exit ) command.
Breakpoint Creation Commands bu (breakpoint uplevel) bu breakpoint uplevel 2 depth 32 \count 32 command-list 3 Sets an uplevel breakpoint to occur immediately on return from the procedure or subprogram at the speci ed depth on the program stack. This command is useful for examining values returned from procedures or subprograms.
Breakpoint Status Commands ab (activate breakpoint) ab activate breakpoint number * Activates the breakpoint having the number (ID) that you specify. If you do not enter a number, the breakpoint at the current line is activated. If there is no breakpoint at the current line, the debugger displays all the breakpoints so that you can select one to activate. Use the asterisk (* ) to activate all breakpoints including, all-procedure and all-paragraph breakpoints.
All-Procedures Breakpoint Commands All-Procedures Breakpoint Commands bp (breakpoint procedure) bp breakpoint procedure 2 command-list 3 Sets permanent procedure breakpoints at the rst executable statement of every procedure for which debugger information is available (this is equivalent to executing a bb (breakpoint beginning ) for every procedure. The breakpoint is encountered each time the procedure is entered. When any entry procedure breakpoint is encountered, the command list is executed.
All-Procedures Breakpoint Commands 2 bpt command-list bpt 3 Sets permanent procedure trace breakpoints at the rst and last executable statement of every procedure for which debugger information is available. The breakpoints are encountered each time the procedure is entered and exited. The command list, if any, is associated with the entry breakpoint. See the de nition for command list at the beginning of this section, \Breakpoint Commands".
All-Procedures Breakpoint Commands 2 bpx bpx command-list 3 Sets permanent procedure exit breakpoints after the last executable statement of every procedure for which debugger information is available. The breakpoint is encountered each time the procedure is exited. When any procedure exit breakpoint is encountered, the command list is executed. See the de nition for command list at the beginning of this section, \Breakpoint Commands".
Global Breakpoint Commands abc abc command-list De nes a global breakpoint command list which will be executed whenever any user-de ned breakpoint is encountered. This includes single, procedure, procedure trace, procedure exit, paragraph, or paragraph trace breakpoints. These commands will be executed before any commands associated with the breakpoint. See the de nition for command list at the beginning of this section, \Breakpoint Commands".
All-Paragraph Breakpoint Commands All-Paragraph Breakpoint Commands bpg (breakpoint paragraph) bpg breakpoint paragraph 2 command-list 3 Sets permanent paragraph breakpoints at the rst executable statement of every HP COBOL II paragraph and section for which debugger information is available. The breakpoint is encountered each time the paragraph or section is entered. When any entry paragraph breakpoint is encountered, the command list is executed.
All-Paragraph Breakpoint Commands tpg (trace paragraph) tpg trace paragraph 2 command-list 3 Sets permanent paragraph trace breakpoints at the rst executable statement of every HP COBOL II paragraph and section for which debugger information is available. The breakpoints are encountered each time the paragraph or section is entered. The command list, if any, is associated with the entry breakpoint. See the de nition for command list at the beginning of this section, \Breakpoint Commands".
Auxiliary Breakpoint Commands Auxiliary Breakpoint Commands any string " \ Although the any string , if , and Quiet commands are not actually breakpoint commands, they are used almost exclusively in breakpoint and assertion command lists. Consequently, they are documented here. "any string" Causes any string that is enclosed in quotation marks to be echoed to the screen. The string command is useful for labeling breakpoint output, particularly for recording a debugger session.
Assertion Control Commands An assertion is a list of one or more debugger commands that are executed before each source statement. Assertions are useful for tracing serious software defects, such as corrupt global variables, or mysterious side e ects. The assertion control commands are: a (assert) aa (activate assertion) da (delete assertion) la (list assertions) sa (suspend assertion) ta (toggle assertions) x (exit) Assertions can be activated or inactivated (suspended) individually.
Assertion Control Commands Caution In an assertion command list, you can use the following job control commands only after an x (exit ) command, which suspends execution of the program. r (run) R (Run) c (continue) C (Continue) s (step) S (Step) k (kill) Also, job control commands cannot be used in an assertion command list unless all assertions are suspended rst. The following is an example of a typical command list command sequence. {l; x 1; c} The following examples show how to use this command.
Assertion Control Commands aa (activate assertion) aa activate assertion number * Activates the assertion having the number (ID) that you enter. Use the la (list assertions ) command to determine the number associated with an assertion. Using the * option causes all assertions to be activated. Overall assertion mode is activated if the last suspended assertion is activated.
Assertion Control Commands sa (suspend assertion) sa suspend assertion number * Suspends the assertion having the number (ID) that you enter. Use the la (list assertions ) command to determine the number associated with an assertion. Using the * option causes all assertions to be suspended. Suspended assertions continue to exist but are not evaluated until activated again. Overall assertion mode is suspended if the last active assertion is suspended.
Datatrace Control Commands A datatrace is used to monitor the value of one or more variables. When the value changes, commands speci ed in a command list are executed. Datatraces are useful for tracing serious software defects, such as corrupt global variables, or mysterious side e ects.
Datatrace Control Commands Caution In a datatrace command list, you can use the following job control commands only after an x (exit ) command, which suspends execution of the program. r (run) R (Run) c (continue) C (Continue) s (step) S (Step) k (kill) Also, job control commands cannot be used in a datatrace command list unless all datatraces are suspended rst. The following is an example of a typical command list command sequence. {l; x 1; c} The following examples show how to use this command.
Datatrace Control Commands adt (activate datatrace) adt activate datatrace number * Activates the datatrace having the number (ID) that you enter. Use the ldt (list datatraces) command to determine the number associated with a datatrace. Using the * option causes all datatraces to be activated. Overall datatrace mode is activated if the last suspended data trace is activated.
Datatrace Control Commands sdt (suspend datatrace) sa suspend datatrace number * Suspends the datatrace having the number (ID) that you enter. Use the ldt (list datatraces) command to determine the number associated with a datatrace. Using the * option causes all datatraces to be suspended. Suspended datatraces continue to exist but are not evaluated until activated again. Overall datatrace mode is suspended if the last active datatrace is suspended.
Datatrace Control Commands Record and Playback Commands The record and playback commands allow reproduction of an HP Symbolic Debugger session by saving debugger commands in a le, which can later be used to execute the commands. The record and playback commands are useful for nding bugs that require many debugger actions to isolate or reproduce. The record-all command is useful for saving a log of the entire session.
Record and Playback Commands Record and Playback Commands Table 4-5. Record and Playback Commands Command > Sets or changes the record le to le , turns recording on, rewrites the le from the beginning, and only records commands. If le exists, you are asked if you want to overwrite. le >> Description le > < le << le Sets or changes the record le to le , turns recording on, and only records commands. All recording is appended to the existing le ; otherwise, a new le is created.
Record and Playback Commands Table 4-6. Commands Used to Record Debugger Output Command >@ 4-70 Sets or changes the record-all le to le , rewrites from the beginning, and turns recording on. If le exists, you are asked if you want to overwrite. Captures all input to and output from the debugger command window, except user program output. le >>@ Description le Sets or changes the record-all le to le , and turns recording on. Appends record-all output to the existing le .
Macro Facility Commands The macro facility allows you to substitute your own names for debugger commands or sequences of debugger commands. To do so, you simply de ne the text to be used as a straight replacement for the macro name. Thereafter, you can use your newly de ned macro name to represent the debugger commands while inside a debugger session. Macro Facility Commands Macros do not allow argument substitution and are only recognized when used where a command is valid.
Macro Facility Commands creates a macro called myprint which can be entered at the debugger prompt in the place of typing: p flavor:list->head.
Macro Facility Commands If a macro can be de ned with the same name as a previous macro, The new de nition will replace the old one, until it is unde ned with the undef command, at which point the old de nition is active. Note tm (toggle macros) tm toggle macros Toggles the state of the macro mechanism between active and suspended. When macros are suspended, the currently de ned macros continue to exist, but are not replaced in the command line by their de nitions.
The miscellaneous commands perform a variety of individual tasks. The miscellaneous commands are: ! : # Miscellaneous Commands 4RETURN5 ~ am (activate more) debug f (format) g (goto) h (help) q (quit) sm (suspend more) tc (toggle case) ! ! 2 MPE command 3 Escapes out of the debugger into the operating system. If a command is speci ed, it is automatically executed. Otherwise, a session is invoked and must be explicitly ended before the debugger can resume.
Miscellaneous Commands : : 2 MPE command 3 Escapes out of the debugger into the operating system. If a command is speci ed, it is automatically executed. Otherwise, a session is invoked and must be explicitly ended before the debugger can resume. When you execute the : command interactively, return to the debugger by hitting the 4RETURN5 key. When you use this command in an assertion or breakpoint command list, control returns to the debugger automatically.
Miscellaneous Commands ~ ~ Repeats the previous command. You must use the 4RETURN5 key after typing the ~ . You can use this command with the following commands: + p (print) v (view) s (step) S (Step) This command is synonomous with the 4RETURN5 command, but is more \visible" in a record or playback le. am (activate more) am activate more Activates (enables) the more feature. (Active is the initial state).
Miscellaneous Commands f (format) f format 2 "printf-style-format" 3 Sets the printing format used by the debugger to print an address. Only the rst 19 literal and formatting characters are used (see the section on printf in the HP C/XL Library Reference Manual for a discussion of valid formats). If the format is set incorrectly, an error message appears. Using the f (format ) command without an argument will reset the format to the default format: 8 hexadecimal digits, preceded by \0x".
Miscellaneous Commands h (help) h help Prints a command summary, called the Help le which describes the syntax and use of each command. This facility references the short form of the command only, not the long form. The more facility can be used to view the le. When activated, all command window output following a debugger command is presented to you a window-full at a time, and you are prompted before displaying successive windows. Use one of the following commands to continue.
Miscellaneous Commands tc (toggle case) tc toggle case Toggles case sensitivity; determines whether or not searches or names are case sensitive (Initially, they are case insensitive.) This command a ects le and procedure names, variables, and search strings used with the / or ? commands. Case insensitive searches equate some non-letters with other non-letters. For example, [ and { are equal, as are @ and `.
A Messages This appendix lists messages that you may encounter while using HP Symbolic Debugger. Self-explanatory messages and those which relate to syntax errors, such as missing or extraneous characters in commands, are not listed in this appendix. To assist you in nding the solution to a problem, several messages may be displayed. Look up each message in this appendix to get complete information about the action to take. Messages are preceded by unique reference numbers that indicate the error type.
A list of abbreviations that are used throughout this appendix and their meanings follow. Note that in all explanations, commands are given in long form, but the short form may also be used. See the chapter \HP Symbolic Debugger Commands" for further details. ABBREVIATION CMD FILE NAME NUM PROC TEXT UEnnn DBnnn A-2 Messages DEFINITION A debugger command. The name of a le. The name of a data object. A number. A user program or procedure name. A text string; arbitrary user input. User-created error.
User Errors (UE300 UE785) User errors result from entering incorrect commands or from using the commands incorrectly. User errors cause the command that you entered to fail. You must correct the cause of the error and re-enter the command. UE300 MESSAGE Attempt to read on non-word boundary CAUSE The debugger cannot read on a non-word aligned address. Do not try to read at a non-word boundary. An incorrect reference to a data item has probably been made.
UE305 UE306 MESSAGE No child process AND no corefile CAUSE ACTION The debugger attempted an operation that required a child process or a core le. Start a child process using any of the r (run) or s (step) commands, or restart the debugger on a valid core le. MESSAGE Attempt to write to non-word boundary. CAUSE The debugger cannot write to a non-word aligned address. Do not try to write to a non-word boundary. An incorrect reference to a data item has probably been made.
UE310 MESSAGE Can't set breakpoint (invalid address) CAUSE The address of the speci ed breakpoint command was invalid or unknown. Re-enter the breakpoint command with a correct address or location. ACTION UE311 UE312 MESSAGE Stack isn't that deep CAUSE ACTION The debugger tried to set a breakpoint or view a procedure at an invalid depth. The child process stack was not that deep. Use the trace command to list the child process stack.
UE315 MESSAGE Invalid line number on "breakpoint" command CAUSE The quantity given for a line number on a breakpoint command was an invalid numeric expression. Re-enter the command with a valid expression. ACTION UE319 MESSAGE Invalid line number on "CMD" command CAUSE The quantity given for a line number on a b (breakpoint), v (view), or c (continue) command, was an invalid numeric expression. Re-enter the command with a valid expression.
UE324 MESSAGE No count given for "breakpoint" command CAUSE The user failed to specify a breakpoint count (after the \) for a breakpoint command. Or, an attempt was made to use the bc (breakpoint count) command on an existing breakpoint. Refer to the \Breakpoint Commands" section in the Chapter 4 of the HP Symbolic Debugger/iX User's Guide to see the correct syntax for breakpoint commands.
UE327 MESSAGE No count given for "breakpoint count" command CAUSE The user failed to specify a breakpoint count (after the \) for a breakpoint command. Or, an attempt was made to use the bc (breakpoint count) command on an existing breakpoint. Refer to the \Breakpoint Commands" section in the Chapter 4 of the HP Symbolic Debugger/iX User's Guide to see the correct syntax for breakpoint commands.
UE330 MESSAGE No count given for "breakpoint exit" command CAUSE The user failed to specify a breakpoint count (after the \) for a breakpoint command. Or, an attempt was made to use the bc (breakpoint count) command on an existing breakpoint. Refer to the \Breakpoint Commands" section in the Chapter 4 of the HP Symbolic Debugger/iX User's Guide to see the correct syntax for breakpoint commands.
UE335 MESSAGE Must specify which macro to delete CAUSE The undef command was entered to delete or unde ne a macro without giving the name of the macro to delete. Use the lm (list macros) command to list all de ned macros. ACTION UE336 UE337 UE339 MESSAGE Unknown name or command "NAME" CAUSE ACTION An unrecognized string (NAME) was encountered as a debugger command. Refer to the HP Symbolic Debugger/iX Quick Reference to see tables of valid debugger commands.
UE343 MESSAGE Address is required after "CMD" CAUSE The breakpoint command must be followed by a code address. Use a valid code address (symbolic or numeric) with the command. ACTION UE344 MESSAGE Invalid depth given for "breakpoint CMD" command CAUSE An attempt was made to specify a depth that is not a number greater than or equal to 0. Re-enter the appropriate command with a valid depth.
UE348 MESSAGE Invalid depth given for "breakpoint exit" command CAUSE An attempt was made to specify a depth that is not a number greater than or equal to 0. Re-enter the appropriate command with a valid depth. ACTION UE349 MESSAGE Invalid depth given for "CMD" command CAUSE An attempt was made to specify a depth that is not a number greater than or equal to 0. Re-enter the appropriate command with a valid depth.
UE359 MESSAGE Invalid expression for depth on "V" command CAUSE The V command was given with an expression for a depth that the debugger cannot evaluate. Use the t (trace) command to view the stack for the proper procedure and depth. ACTION UE364 MESSAGE Missing "{" CAUSE The i (if) command did not have a brace ({) following the conditional expression. Or, the expression might have been entered incorrectly. Re-enter the expression, enclosing the command-lists in braces.
UE373 MESSAGE Invalid expression given for "suspend assertion" command CAUSE The sa (suspend assertion) command was given with an expression that the debugger cannot evaluate. Use an expression which evaluates to a number. ACTION UE374 MESSAGE Invalid expression given for "sa" command CAUSE The sa (suspend assertion) command was given with an expression that the debugger cannot evaluate. Use an expression which evaluates to a number.
UE380 MESSAGE Invalid expression given for "CMD" command CAUSE A non-numeric expression was entered as part of the s (step), S (Step), t (trace), T (Trace), or sa (suspend assertion) command. Re-enter the command with a correct numeric expression. ACTION UE382 MESSAGE Invalid expression given for "trace" command CAUSE A non-numeric expression was entered as part of the t (trace) command. Re-enter the command with a correct numeric expression.
UE388 MESSAGE Invalid expression for mode on "x" command CAUSE The x (exit) command was given with an expression for mode that the debugger could not evaluate. Replace the mode expression with a valid numeric expression. ACTION UE390 UE391 MESSAGE Unknown name or command "CMD" CAUSE ACTION Your command is not recognized by the debugger. Enter a valid debugger command. MESSAGE No playback name specified CAUSE The le name is missing in a playback command.
UE396 MESSAGE Data too big to put in the child process CAUSE A string constant or other data was larger than the total size of the bu er in xdbend.lib.sys. Re-enter a smaller string constant or data item, if applicable. ACTION UE397 MESSAGE Can't store into a constant CAUSE The left side of an assignment statement was found to be a constant; it cannot be modi ed. Use the \t display format for information on the assigned variable.
UE403 MESSAGE Can't take the address of a register CAUSE The operand of a &, $addr, or addr operator is marked as a register type. Use the \t display format to nd the type of the operand. ACTION UE404 UE405 MESSAGE Prefix "++" not supported CAUSE ACTION An attempt was made to use an unsupported ++ pre x operator. Make sure there is a space between a + and a unary + operator (for example 2+ +5). +=1 can be used to increment.
UE408 MESSAGE Misformed expression CAUSE An expression was entered incorrectly. The debugger attempts to show you where the error was detected in the command line. The error token might be one token beyond the actual error. Re-enter the expression using operators and operands known to the current language or reset $lang to the language in which the operator or operand is valid. ACTION UE409 MESSAGE Two operators in a row CAUSE The expression handler detected an improper construct in an expression.
UE413 UE414 UE415 MESSAGE Invalid real number CAUSE ACTION The speci ed numeric expression was not a real number. See the appropriate language reference manual, or Table 4-3 in this manual, for the format of real numbers. MESSAGE Misformed global name CAUSE ACTION A : or :: must be followed by a variable name (string). Refer to the \Entering Variable Names" section in Chapter 4 of the HP Symbolic Debugger/iX User's Guide to see how to specify global variables.
UE418 MESSAGE Unknown local CAUSE The variable speci ed with proc [:depth ]:var was not a recognized local variable of proc . Use the l (list) command to list all known local variables of the current proc , or use the T (Trace) command to list the locals, variables, and procedures on the stack. ACTION UE419 MESSAGE Procedure "PROC" not found at stack depth NUM CAUSE In proc :depth , the procedure PROC was not on the child process stack at depth NUM.
UE423 UE424 MESSAGE No source file for current address CAUSE ACTION The given child process address did not map to a known, debuggable source le. Use the lf (list files) command to view the les the debugger recognizes, and re-enter the command with an appropriate address expression.
UE428 MESSAGE Length not allowed with "TEXT" format CAUSE Given the data display format, the TEXT did not allow the data length speci cation because it is irrelevant or implicit in the format. Refer to Table 4-3 in Chapter 4 of the HP Symbolic Debugger/iX User's Guide to see valid data viewing formats. ACTION UE429 MESSAGE This does not appear to be a record or union CAUSE The debugger tried and failed to dump the contents of a data object that was not a record or union.
UE434 MESSAGE No such procedure "PROC" CAUSE An attempt to list locals of a non-existent, or non-debuggable procedure PROC was made. Use the lp (list procedures) command to list all known debuggable procedures. ACTION UE435 MESSAGE Unrecognized "l" command CAUSE The l (list) command was given with a second part that was neither a known procedure name, nor a valid option. Refer to the l (list) command listing in Chapter 4 of the HP Symbolic Debugger/iX User's Guide for more information.
UE441 MESSAGE Can't goto a location in another procedure CAUSE The line number given to the g (goto) command was not an executable source line in the top procedure on the child process stack. This is not always the same as the current viewing procedure. Re-enter the g (goto) command with a line number within the procedure on the top of the child process stack. ACTION UE443 UE444 MESSAGE Signal actions are "i", "r", "s", "Q" CAUSE ACTION An invalid signal action was given.
UE447 MESSAGE Misformed octal number CAUSE An octal number starting with 0 contains an 8 or 9. Re-enter the command with the correct octal number. ACTION UE448 MESSAGE Character constant is missing ending ' CAUSE Token parsed as a character constant is missing a trailing single quotation mark ('). This applies to a single quotation mark followed by a single character or an equivalent backslash sequence. Re-enter the command enclosing the character constant in single quotation marks (').
UE452 MESSAGE Sorry, you can't access a naked field CAUSE An attempt was made to refer to a eld by name without specifying the qualifying structure (for example, union, record, pointer, etc.). Use the \t display format on the structure object to examine its type information. ACTION UE453 MESSAGE Too many subscripts CAUSE An attempt was made to dereference an array with more dimensions than it was declared to have. However, HP C does allow you to dereference pointers in this manner.
UE458 MESSAGE No such field name "NAME" for that union CAUSE The union did not contain a eld of that NAME. Use the \t display format for more information. ACTION UE459 MESSAGE Illegal cast CAUSE The expression contains an illegal cast. Re-enter the command with a valid expression. When casting with a class, structure, or union type, the keyword class, struct, or union must be given.
UE475 MESSAGE Count must be positive CAUSE The count argument given to the c (continue) command is negative or 0. Re-enter the command with a positive count (or none). ACTION UE476 MESSAGE Too many characters in wide-character constant CAUSE More than one valid (possibly multi-byte) character was entered. Re-enter the expression with one character constant.
UE482 MESSAGE Unknown print-mode CAUSE There was an attempt to assign an illegal value to the $print debugger variable. Assign one of these values: ASCII, native, raw. ACTION UE483 UE484 MESSAGE Misformed binary number CAUSE ACTION A misformed binary number was found in an expression. Replace the misformed number with a valid one.
UE605 UE626 MESSAGE Incompatible debug information CAUSE ACTION The debugger was invoked on a le linked on a older version of the operating system. Try relinking your program. If that doesn't solve the problem, you will have to recompile the program. MESSAGE Attempt to read from ODD address CAUSE ACTION UE632 MESSAGE Wide-character constant not allowed ($lang must be 'C') CAUSE Attempt to use a wide character constant while the language is not C. Set $lang to C and re-enter the expression.
UE654 MESSAGE Breakpoint count ignored CAUSE A count is meaningless for class, overload, or instance breakpoints on multiple member functions. None required. The count was ignored but the breakpoint was set. ACTION UE655 MESSAGE This does not appear to be a struct or union CAUSE The S display format was speci ed but the type of the object to print is not a struct or union. If you want to do a formatted dump of an address, cast the address to some struct or union.
UE663 MESSAGE Invalid file on "breakpoint" command CAUSE A le speci ed as part of a breakpoint location is not known to the debugger. Re-enter the command with a valid le name. Use the lf (list files) command to list all valid source les and the path name you must use. ACTION UE664 UE665 MESSAGE Invalid procedure on "breakpoint" command CAUSE ACTION A procedure speci ed as part of a breakpoint location is not known to the debugger. Re-enter the command with a valid procedure name.
UE670 MESSAGE Invalid procedure on "continue" command CAUSE A procedure speci ed as part of a continue location is not known to the debugger. Re-enter the command with a valid procedure name. Use the lp (list procedures) command to see a list of all valid procedures. ACTION UE671 MESSAGE Invalid line number on "continue" command CAUSE A line speci ed as part of a continue location is out of range for the associated le. Re-enter the command with a valid line number.
UE677 MESSAGE Invalid procedure on "Continue" command CAUSE A procedure speci ed as part of a continue location is not known to the debugger. Re-enter the command with a valid procedure name. Use the lp (list procedures) command to see a list of all valid procedures. ACTION UE678 MESSAGE Invalid line number on "Continue" command CAUSE A line speci ed as part of a continue location is out of range for the associated le. Re-enter the command with a valid line number.
UE685 UE686 MESSAGE Invalid line number on "view" command CAUSE ACTION A line speci ed as part of a view location is out of the range of the associated le. Re-enter the command with a valid line. MESSAGE Invalid label on "view" command CAUSE A label speci ed as part of a view location is not known to the debugger. Re-enter the command with a valid label name.
UE696 UE697 MESSAGE Must specify breakpoint to delete CAUSE ACTION Although there is a breakpoint at the current viewing location, a breakpoint number must be given with the db (delete breakpoint) command. Use the lb (list breakpoints) command to nd the number of the breakpoint you want to delete and re-enter the db (delete breakpoint) command with the breakpoint number. MESSAGE Must specify function name CAUSE The bpo (breakpoint overload) command was invoked without a function name.
UE710 UE726 UE729 MESSAGE Must specify breakpoint to activate CAUSE ACTION Although there is a breakpoint at the current viewing location, a breakpoint number must be given with the ab (activate breakpoint) command. Use the lb (list breakpoints) command to nd the number of breakpoints you want to activate and re-enter the ab (activate breakpoint) command with the breakpoint number.
UE733 MESSAGE Invalid procedure given for "breakpoint trace" command CAUSE The debugger could not nd a procedure with the speci ed name. Use the lp (list procedures) command to nd what procedures are known to the debugger, and re-enter the command with the corrected name. Alternatively, if the procedure you supplied was not compiled with the debug ag, you can still set a breakpoint at its entry point by using the 'ba address ' command.
UE785 MESSAGE Address is required after "va" CAUSE The va command was entered with no parameter. Re-enter the command with an address argument.
Debugger Errors (DB1-DB8) DB1 MESSAGE Assigning to NUM byte object from NUM byte object; moved NUM bytes CAUSE The object on the left side of an assignment was not equal to the size of the right side of the expression. The debugger copied a series of bytes equal in size to the left side of the assignment statement. Re-enter the command, using expressions of equal length, or else results based on truncation will occur.
B HP C Language Operators This appendix lists and describes operators for the HP C programming language that the debugger expression evaluator recognizes. HP C Language Operators The following table lists the supported HP C operators. Operators are listed in order of precedence, from highest to lowest. All operators listed in the same box are of equal precedence. Associativity of operators in the following table is from left to right, unless otherwise stated.
HP C Language Operators Table B-1. Language Operators for HP C Operator B-2 HP C Language Operators Operation () parenthesis (group elements) [] array member selection -> member selection of pointer to structure .
Table B-1. Language Operators for HP C (continued) Operator Operation & bit-wise logical and ^ bit-wise logical exclusive or j && jj bit-wise logical inclusive or logical and logical or =(order is right to left ) assignment op=(order is right to left ) assignment operators of the form: e1 op= e2 which means (e1) = (e1) op (e2).
C HP FORTRAN 77 Language Operators and VMS Record Support This appendix lists and describes operators for the HP FORTRAN 77 programming language that the debugger expression evaluator recognizes. HP FORTRAN 77 Language Operators The following table lists the supported HP FORTRAN 77 operators. Operators are listed in order of precedence, from highest to lowest. All operators listed in the same box are of equal precedence. All operators of equal precedence evaluate left to right, except assignment.
HP FORTRAN 77 Language Operators Table C-1. Language Operators for HP FORTRAN 77 Operator Operation () parentheses (grouping), array member selection * multiplication / division + addition - subtraction or unary negation .LT. relational less than .LE. relational less than or equal to .EQ. relational equal to .GE. relational greater than or equal to .NE. relational not equal to .GT. relational greater than .NOT. logical negation .AND. logical and .OR. logical or .EQV.
VMS FORTRAN Records HP Symbolic Debugger provides support for VMS FORTRAN records. There are four associated types: structures records unions maps A structure de nes record eld types such as in the following example: structure /date/ integer a union map integer b real c character*8 d integer e union map logical f integer g end map map character*3 h end map map real i end map end union end map end union real j integer f end structure A record corresponds to an instance of that record structure.
In HP Symbolic Debugger, HP FORTRAN 77 records are treated as HP FORTRAN 77 structures from the debugger. This means that if you use the print command with the nt format to look at a record, you will see the record's structure rather than the record de nition, record /date/ rec1.
You can access any element within a record. Because maps and unions are unnamed, they are ignored in naming subelements. For example, eld h in the previous example must be accessed as: rec1.h If there is any ambiguity among eld names, the rst one appearing by a given name is chosen, just as it is in HP FORTRAN 77. For example, eld rec1.f in the example above is of type logical , not integer.
D HP Pascal Language Operators This appendix lists and describes operators for the HP Pascal programming language that the debugger expression evaluator recognizes. HP Pascal Language Operators The following table lists the supported HP Pascal operators. Operators are listed in order of precedence, from highest to lowest. All operators listed in the same box are of equal precedence. All operators of equal precedence evaluate left to right, except assignment.
HP Pascal Language Operators Table D-1. Language Operators for HP Pascal Operator Operation () parenthesis, group elements [] array member selection .
E HP COBOL II Language Operators This appendix lists and describes operators for the HP COBOL II programming language that the debugger expression evaluator recognizes. HP COBOL II Language Operators The following table lists the supported HP COBOL II operators. Operators are listed in order of precedence, from highest to lowest. All operators listed in the same box are of equal precedence. All operators of equal precedence evaluate left to right, except assignment.
Dereferencing Operations There are two supported HP COBOL II dereferencing operations, eld dereferencing (variable quali cation ) and array dereferencing . Field Dereferencing There are two operators that are supported for eld dereferencing (variable quali cation): . of The di erence in these operators is the order in which the elds are listed. The . (dot ) operator is used to specify a quali ed path from the parent eld down; the of operator is used to specify the path from the child eld up.
With this structure, chico would not be unique, nor would marx.chico. The minimum quali cation necessary is either: disp bat.chico OR disp chico of bat If a name is fully quali ed such as fob.bat.marx.chico, it must always be unique. Array Dereferencing HP COBOL subscripts applied to a structure are always listed at the end of the eld list.
F Special Variables Used by the Symbolic Debugger This appendix covers special variables that are not normally directly accessible. Special Variables Table F-1. Special Variables Variable Description $var Represents user-de ned variables. They are of type long integer and do not take on the type of any expressions assigned to them. Hardware Registers Represents the names of the registers, the program counter and stack, data, argument and return-value pointers. $r0 . . .
Table F-1. Special Variables (continued) Variable F-2 Description $line Displays the current source line number (the next statement to be executed). It is automatically set by a number of di erent commands. $malloc Allows you to see the amount of memory (in bytes) currently allocated by the debugger for its own use. This does not re ect memory use of the program being debugged.
G Limitations and Hints This appendix lists some limitations of HP Symbolic Debugger and gives some hints for debugger usage. Limitations and Hints 4CNTRL5Y should be a trap that performs like the hardware traps. That is, if the child process is running, it should be forced to stop with control transferred to the debugger. This allows in nite loops to be temporarily broken without aborting the debugger.
The debugger supports call-by-reference only for known parameters of known (debuggable) procedures. If the object to pass lives in the child process, you can fake such a call by passing &object , for example, the address of the object. Only the rst number of a complex pair is passed as a parameter. Functions which return complex numbers are not called correctly; insu cient stack space is allocated for the return area, which can lead to overwriting the parameter values.
H Installed Files This appendix lists the installed les for the HP Symbolic Debugger. Debugger Installation These are the les needed to use the HP Symbolic Debugger on your system. xdbend.lib.sys The le xdbend.lib.sys must be linked at the end of the user program to give the debugger private data space in the user process. xdb.pub.sys The le xdb.pub.sys is the HP Symbolic Debugger/iX executable program le with shared access. pxdb.pub.sys The le pxdb.pub.
I HP Symbolic Debugger Commands This section describes command syntax and gives a description of all the HP Symbolic Debugger commands. Enter the following command to start the debugger: 2 2 -d 6 6 -r 6 6 6 6 -p 6 run xdb.pub.sys 6 6 ;info="6 -L 6 6 4 4 -S 2 group .acct le le num object le 33 7 7 72 7 7 7 5 3 ...
-d group.[acct ] -p le -r le -L -S num object le I-2 HP Symbolic Debugger Commands This option names an alternate group and (optional) account containing the source les used to create the object le . Group and accounts are searched in the order that you list them. The current group and account is used if the le is not found in the group and account that you enter here. You can enter more than one -d option.
Window Mode Commands Window Mode Commands Table I-1. Window Mode Commands Cmd fr Syntax Description Displays the PA-RISC oating point fr registers in the register window when floating point registers the debugger is in disassembly mode. Each register appears as a two word pair (two sets of eight hexadecimal digits).
File Viewing Commands Table I-2. File Viewing Commands Cmd + - / ? Syntax 2 - 2 / D ld lf number string n HP Symbolic Debugger Commands Moves forward in the current le the speci ed number of lines (or the speci ed number of instructions in disassembly mode). If you do not enter a number, the next line (or instruction) becomes the current line (or instruction).
File Viewing Commands Table I-2. File Viewing Commands (continued) Cmd Syntax v V va Description Displays one source window forward from the current source window. One line from the previous window is preserved for context. If your terminal does not support windowing, only the new source line is displayed. Using the location option causes the speci ed location to become the current location, and the source at the speci ed location is then displayed in the source window.
Data Viewing and Modification Commands Table I-3. Data Viewing and Modification Commands Cmd Syntax disp l 2 lc 2 lg 2 ll lm 2 lp 2 lr I-6 HP Symbolic Debugger Commands ls 2 Lists all global variables and their values. If a string is speci ed, only those global variables whose names begin with this string are listed. 3 Lists all labels and program entry points known to the linker. If a string is speci ed, only those symbolic addresses with this pre x are used.
Data Viewing and Modification Commands Table I-3. Data Viewing and Modification Commands (continued) Cmd mov Syntax Description Used only with HP COBOL II mov expr1 to expr2 programs to modify variables. The move rst expression is the source ; the second is the destination . The source and destination cannot be an edited eld. The source can be any non-edited COBOL eld, a string literal, a number, or a named constant (such as SPACES or BLANKS). The destination can be any non-edited COBOL eld.
Stack Viewing Commands Table I-4. Stack Viewing Commands Cmd Syntax t T Description Prints a stack trace. You can optionally specify a depth . The default depth is 20 levels. If an optional depth is supplied, only the procedures up to this depth in the stack are displayed. Prints a stack trace. You can optionally specify a depth . The default depth is 20 levels. If an optional depth is supplied, only the procedures up to this depth in the stack are displayed.
Status Viewing Command Status Viewing Command Table I-5. Status Viewing Command Cmd I Syntax I Inquire Description Prints the current state of the debugger. The output contains information such as the version number of the debugger, program name, number of source les and procedures, process id of the child process, number of breakpoints, record and playback information, etc.
Job Control Commands Table I-6. Job Control Commands Cmd c Syntax Description Resumes execution after a 2 3 c location breakpoint or a signal has been continue encountered, ignoring the signal, if any. If a location is speci ed, a temporary breakpoint is set at that location. C Resumes execution after a 3 2 C location breakpoint or a signal has been Continue encountered, allowing the signal, if any, to be received by the child process.
Job Control Commands Table I-6. Job Control Commands (continued) Cmd S Syntax 3 2 S number Step Description Single steps through a program. In source mode, one source statement (or one step of a multiple step statement in HP Pascal or HP C) is executed; in disassembly mode, one machine instruction is executed (several machine instructions might be equivalent to one source statement). If a procedure call is encountered, it is not \stepped into".
Breakpoint Commands Overall Breakpoint Commands Table I-7. Overall Breakpoint Commands Cmd I-12 Syntax lb tb HP Symbolic Debugger Commands lb list breakpoints Description Displays all breakpoints in the program, both active and suspended, and the overall breakpoint state. tb toggle breakpoints Toggles the overall breakpoint state from active to suspended or vice versa. The state of the individual breakpoints remains unchanged.
Breakpoint Commands Breakpoint Creation Commands Table I-8. Breakpoint Creation Commands Cmd b Syntax 2 ba 2 bb 3 32 2 b location \count breakpoint command-list 3 3 2 ba address \count breakpoint address command-list Description 3 Sets a breakpoint at the location that you specify. If you do not enter a location, the current line in the source window is used. The breakpoint is executed on each occurrence (count) that you specify.
Breakpoint Commands Table I-8. Breakpoint Creation Commands (continued) Cmd bt Syntax 2 bt breakpoint trace command-list 3 Description 3 proc 2 \count depth Sets a trace breakpoint at the current or named procedure or at the procedure that is at the speci ed depth on the program stack. A breakpoint is set at the entry and exit point of the procedure. If you include a command list, it is executed at the beginning of the procedure or subprogram.
Breakpoint Commands Table I-8. Breakpoint Creation Commands (continued) Cmd bu Syntax 2 bx 2 3 2 32 bu depth \count breakpoint uplevel command-list Description 3 2 3 32 bx depth \count breakpoint exit command-list 3 Sets an uplevel breakpoint to occur immediately on return from the procedure at the speci ed depth on the program stack. If you do not enter a depth, the procedure shown in the source window is used. The breakpoint is executed on each occurrence (count) that you specify.
Breakpoint Commands Breakpoint Status Commands Table I-9. Breakpoint Status Commands Cmd ab Syntax bc ab activate breakpoint number * Description bc breakpoint count Sets the count of the speci ed breakpoint number to the integer value of the evaluated expression that you enter.
Breakpoint Commands All-Procedures Breakpoint Commands Table I-10. All-Procedures Breakpoint Commands Cmd bp Syntax 2 bpt Description bp breakpoint procedure command-list bpt 2 3 command-list Sets permanent procedure breakpoints at the rst executable statement of every procedure for which debugger information is available. The breakpoint is encountered each time the procedure is entered. When any entry procedure breakpoint is encountered, the command list is executed.
Breakpoint Commands Global Breakpoint Commands Table I-11. Global Breakpoint Commands Cmd abc dbc I-18 HP Symbolic Debugger Commands Syntax abc command-list dbc Description De nes a global breakpoint command list which will be executed whenever any user de ned breakpoint is encountered. These include normal, procedure, procedure trace, and procedure exit breakpoints. Deletes the global breakpoint command list.
Breakpoint Commands All-Paragraph Breakpoint Commands Table I-12. Paragraph Breakpoint Commands Cmd bpg Syntax 2 tpg 2 bpg breakpoint paragraph command-list dpg Description 3 dpg delete paragraph tpg trace paragraph command-list 3 Sets permanent paragraph breakpoints at the rst executable statement of every HP COBOL II paragraph and section for which debugger information is available. The breakpoint is encountered each time the paragraph or section is entered.
Breakpoint Commands Auxiliary Breakpoint Commands Table I-13. Auxiliary Breakpoint Commands Cmd "any Syntax string " "any string" i 2 Q I-20 HP Symbolic Debugger Commands The string command displays any string that is enclosed in quotation marks. i expr command-list if command-list Q Quiet Description 3 The i (if ) command lets you conditionally execute commands in a command list. If the expression evaluates to a non-zero value, the rst group of commands is executed.
Assertion Control Commands Assertion Control Commands Table I-14. Assertion Control Commands Cmd Syntax a aa da aa activate assertion sa ta x la list assertions 2 3 x expr exit Activates the assertion having the number (ID) that you enter. Using the * option causes all assertions to be activated. Overall assertion mode is activated if the last suspended assertion is activated. Deletes the assertion having the number (ID) that you enter.
Assertion Control Commands I-22 HP Symbolic Debugger Commands
Datatrace Control Commands Datatrace Control Commands Table I-15. Datatrace Control Commands Cmd ndt Syntax command-list ldt sdt tdt x 92 silent adt activate datatrace number * ddt Creates a datatrace for the speci ed variable (item ). You can enclose the command list in braces to separate it from other commands on the same line. ndt item datatrace 28 adt Description Activates the datatrace having the number (ID) that you enter.
Datatrace Control Commands Record and Playback Commands Table I-16. Record and Playback Commands Cmd > Sets or changes the record le to le , turns recording on, rewrites the le from the beginning, and only records commands. If le exists, you are asked if you want to overwrite. le >> Description le > < le << le Sets or changes the record le to le , turns recording on, and only records commands. All recording is appended to the existing le ; otherwise, a new le is created.
Record and Playback Commands Table I-17. Commands Used to Record Debugger Output Cmd >@ Sets or changes the record-all le to le , rewrites from the beginning, and turns recording on. If le exists, you are asked if you want to overwrite. Captures all input to and output from the debugger command window, except user program output. le >>@ Description le Sets or changes the record-all le to le , and turns recording on. Appends record-all output to the existing le .
Record and Playback Commands Macro Facility Commands Table I-18. Macro Facility Commands Cmd def Syntax Description De nes a macro substitution (user-de ned command) for HP Symbolic Debugger commands. Name can be any string of letters or digits, beginning with a letter. Replacement-text can be any string of letters, blanks, tabs or other printing characters. The string must be contained on one line.
Macro Facility Commands HP Symbolic Debugger Commands I-27
Miscellaneous Commands Table I-19. Miscellaneous Commands Cmd ! : # 4RETURN5 Syntax 2 ! 2 : # 2 MPE command MPE command text 3 4RETURN5 Description 3 3 Escapes out of the debugger into the operating system. If a command is speci ed, it is automatically executed. Otherwise, a session is invoked and must be explicitly ended before the debugger can resume. When you execute the ! command interactively, return to the debugger by hitting the 4RETURN5 key.
Miscellaneous Commands Table I-19. Miscellaneous Commands (continued) Cmd ~ Syntax Description Repeats the previous command. You must use the 4RETURN5 key after typing the ~ . You can use this command with the following commands: ~ + p (print) v (view) s (step) S (Step) am debug am activate more Activates (enables) the more feature. Transfers control to the MPE NMdebugger by causing the child process to call the \DEBUG" entry point. When you exit, control returns to the HP Symbolic Debugger.
Miscellaneous Commands Table I-19. Miscellaneous Commands (continued) Cmd Syntax h q sm tc do 8 redo 8 2 I-30 HP Symbolic Debugger Commands Prints a command summary, called the Help le which describes the syntax and use of each command. This facility references the short form of the command only, not the long form. The more facility can be used to view the le. Quits the debugger and asks for con rmation: enter y (yes) or n (no).
Registers Displayed by HP Symbolic Debugger J in Disassembly Mode This appendix lists the registers displayed by HP Symbolic Debugger in disassembly mode. Register Names The actual register names used by the debugger as special variables are: $r0..$r31 General registers $f0..$f15 Floating-point (double-word) registers $pc Program counter $sp $dp $arg0..$arg3 $ret0..
Registers Displayed by HP Symbolic Debugger in Disassembly The registers (or register elds) displayed by the debugger in disassembly mode are listed below. The rst section lists the registers displayed in the General Register and Floating-Point Register Window . The second section lists the registers (or register elds) displayed in the Special Register Window . Mode Registers Displayed in the General and Floating-Point Register Window r0..r31 f0..
Glossary address Virtual memory address used to reference program code or data. When used to designate an address with the ba (breakpoint address ) command, it can be either one of the following: Strictly a numeric value (such as 0x00001358) A symbolic address with or without an o set (such as main+0x1c). assertion A list of commands performed before the debugger executes a program statement. Useful for tracking unexpected changes in program data (undesired side e ects).
command name. Commands are separated with a semicolon within a command list. For more information, see chapter 4 HP Symbolic Debugger Commands . command list A sequence of one or more debugger commands separated by a semicolon (;). Some commands expect command-lists as arguments. Braces (fg) must sometimes be used to enclose command-lists. For more information, see the individual command listings in chapter 4 HP Symbolic Debugger Commands .
current location The \point-of-interest" in the source as displayed in the source window. Many commands take this as a default location. The current location is not necessarily the current point of program suspension (where the program is currently paused.) datatrace A list of commands performed when the value of the speci ed variable changes. Useful for tracking unexpected changes in program data (undesired side e ects).
a formatting character an optional object size Glossary-4
The access and display operation is performed once for each repetition (default 1). The number of bytes in each object is determined by the given object size (default depends on the formatting character). The formatting character determines how each object is interpreted and printed. For example, to print four sequential 16-bit integers in octal, use the format 4o2 or 4os. line mode Debugger user interface that does not use any special terminal functions.
breakpoints, requiring that multiple debugging sessions cannot occur with the same executable le. Private copies must be made rst. source Source text ( les) used to compile the user program. These can be in any of the programming languages supported by the debugger. source line A single line of text in a source le, denoted by a line number. A source line might or might not contain actual executable statements. Conversely, more than one statement can occur on a single line.
Index Special characters A !, 4-74 #, 4-74, 4-75 +, 3-12, 4-16 -, 3-12, 4-16 .
a, 4-60 aa, 4-60, 4-62 activate assertion, 4-60, 4-62 assert, 4-60 da, 4-60, 4-62 delete assertion, 4-60, 4-62 examples of, 4-60 exit, 4-60, 4-63 la, 4-60, 4-62 list assertions, 4-60, 4-62 sa, 4-60, 4-63 suspend assertion, 4-60, 4-63 ta, 4-60, 4-63 toggle assertions, 4-60, 4-63 use of assertions, 4-60 x, 4-60, 4-63 assertions, 1-1, 3-29 Auxiliary assertion commands, 4-59 \any string", 4-38, 4-59 i, 4-38, 4-59 if, 4-38, 4-59 Q, 4-38, 4-59 Quiet, 4-38, 4-59 Auxiliary breakpoint commands, 4-38, 4-59 \any strin
breakpoint procedure, 3-20, 4-38, 4-53 breakpoints, 3-20 command list, 4-41 count, 4-39 description, 4-38{45 location, 4-39 permanent, 4-39 resuming execution after, 3-22 setting, 3-20 temporary, 4-39 types of, 4-38{45 use of, 4-38{45 breakpoint trace, 4-38, 4-49 breakpoint uplevel, 4-38, 4-51 bt, 4-38, 4-49 bu, 4-38, 4-51 bx, 4-38, 4-51 C >@c, 4-70 >c, 4-69 c, 3-22, 4-35 C, 4-35 capturing a debugger session, 3-28 carriage return, 4-16 carriage return, use of, 4-74 case sensitive, 4-78 case sensitivity se
compiling HP COBOL II programs, 3-3 continue, 3-22, 4-35 Continue, 4-35 convention character, 4-3 command, 4-1 syntax, 4-1 uppercase and lowercase, 4-1 Creation breakpoint commands, 4-38, 4-48{51 b, 4-38, 4-48 ba, 4-38, 4-48 bb, 4-38, 4-49 breakpoint, 4-38, 4-48 breakpoint address, 4-38, 4-48 breakpoint beginning, 4-38, 4-49 breakpoint exit, 4-38, 4-51 breakpoint trace, 4-38, 4-49 breakpoint uplevel, 4-38, 4-51 bt, 4-38, 4-49 bu, 4-38, 4-51 bx, 4-38, 4-51 current le, 4-18 current line, 4-18 current location
display, 4-21 l, 4-21, 4-22 lc, 4-21, 4-23 lg, 4-21, 4-23 list, 4-21, 4-22 list common, 4-21, 4-23 list globals, 4-21, 4-23 list labels, 4-21, 4-23 list macros, 4-21, 4-23 list procedures, 4-21, 4-24 list registers, 4-21, 4-24 list specials, 4-21, 4-25 ll, 4-21, 4-23 lm, 4-21, 4-23 lp, 4-21, 4-24 lr, 4-21, 4-24 ls, 4-21, 4-25 p, 4-21, 4-26{30 print, 4-21, 4-26{30 short and long form, 4-26 db, 3-23, 4-38, 4-52 dbc, 4-38, 4-56 ddt, 4-64, 4-66 debug, 4-74, 4-76 debugger information, Glossary-3 >debugger prompt
E F echo comment, 4-74 end a debugger session, 4-77 error messages debugger, A-41 user, A-1 Error messages User, A-3 escape, 4-74 exception, Glossary-3 exclamation point, 4-74 executable program le, 1-3 executing a program, 3-4 executing commands at each source line, 3-29 exit, 4-60, 4-63, 4-64, 4-67 expr, Glossary-3 expression, Glossary-3 expression conventions, 4-7{11 >@f, 4-70 >f, 4-69 f, 4-74, 4-77 Figure 1-1. Creating an Executable Program File, 1-3 Figure 2-1.
L, 4-16, 4-18 ld, 4-16, 4-17 lf, 4-16, 4-17 list directories, 4-16, 4-17 list les, 4-16, 4-17 Location, 4-16, 4-18 minus sign, 4-16 n, 4-18 N, 4-18 next, 4-18 Next, 4-18 plus sign, 4-16 question mark, 4-16, 4-17 slash symbol, 4-16 v, 4-16, 4-19 V, 4-16, 4-19 va, 4-16, 4-20 view, 4-16, 4-19 View, 4-16, 4-19 view address, 4-16, 4-20 nding a pattern, 4-16 oating point registers, 4-13 format, 4-74, 4-77, Glossary-3 FORTRAN records de nition, C-3 FORTRAN structures de nition, C-3 printing the type, C-5 printing
user requirements, 1-2 I J K L Index-8 i, 4-38, 4-59 I, 4-34 if, 4-38, 4-59 Inquire, 4-34 installation les, H-1 installation of the debugger, H-1 installation of the debugger les, H-1 installing the HP Symbolic Debugger, H-1 Job control commands, 4-35{37 c, 4-35 C, 4-35 continue, 4-35 Continue, 4-35 k, 4-35 kill, 4-35 r, 4-35, 4-36 R, 4-35, 4-36 run, 4-35, 4-36 Run, 4-35, 4-36 s, 4-35, 4-36 S, 4-35, 4-37 step, 4-35, 4-36 Step, 4-35, 4-37 k, 3-10, 4-35 kill, 3-10, 4-35 l, 4-21, 4-22 L, 4-16, 4-18 la, 4-
lg, 4-21, 4-23 limitations and hints, G-1 linking a program symbolic debugger information, 3-2 list, 4-21, 4-22 list assertions, 4-60, 4-62 list breakpoints, 3-22, 4-38, 4-46 list common, 4-21, 4-23 list datatraces, 4-64, 4-66 list directories, 4-16, 4-17 list les, 4-16, 4-17 list globals, 4-21, 4-23 listing les, 3-3 list label command, 4-11 list labels, 4-21, 4-23 list macros, 4-21, 4-23 list procedures, 4-21, 4-24 listredo, 4-74, 4-79 list registers, 4-5, 4-21, 4-24 list specials, 4-3, 4-21, 4-25 ll, 4-21
do, 4-74, 4-79 escape, 4-74 exclamation point, 4-74 f, 4-74, 4-77 format, 4-74, 4-77 g, 4-74, 4-77 goto, 4-74, 4-77 h, 4-74, 4-78 help, 4-74, 4-78 listredo, 4-74, 4-79 number sign, 4-74, 4-75 q, 4-74, 4-78 quit, 4-74, 4-78 redo, 4-74, 4-79 4RETURN5, 4-74, 4-75 sm, 4-74, 4-78 suspend more, 4-74, 4-78 tilde, 4-74, 4-76 toggle case, 4-74, 4-79 Miscellaneous Commands, 4-74{79 modifying data, 3-26 more, 3-13 mov, 3-26, 4-21, 4-25 move, 3-26, 4-21, 4-25 move lines backward, 4-16 move lines forward, 4-16 N O P
procedure call conventions, 4-11 program arguments, 4-36 Q R q, 3-11, 4-74, 4-78 Q, 4-38, 4-59 question mark, 4-16, 4-17 Quiet, 4-38, 4-59 quit, 3-11, 4-74, 4-78 quit the debugger, 4-77 r, 3-9, 4-35, 4-36 R, 3-9, 4-35, 4-36 Record and playback description, 4-68 Record and playback commands, 4-68{70 >, 4-69 >@, 4-70 >@c, 4-70 >c, 4-69 >@f, 4-70 >f, 4-69 << le, 4-69 < le, 4-69 >>@ le, 4-70 >> le, 4-69 >@ le, 4-70 > le, 4-69 limitations, 4-68 >@t, 4-70 >t, 4-69 tr, 4-69 tr @, 4-70 Record and playback les com
S Index-12 s, 3-9, 3-18, 4-35, 4-36 S, 3-9, 3-18, 4-35, 4-37 sa, 4-60, 4-63 sample debugger session, 2-1 sample program HP C, 2-11 HP COBOL II, 2-6, 2-7 HP FORTRAN 77, 2-8 HP Pascal, 2-9 sb, 4-38, 4-52 sdt, 4-64, 4-67 search backward, 4-16, 4-17 searches, case sensitive, 4-78 search forward, 4-16 searching a program, 3-19 setting all-procedure breakpoints, 3-22 sharable code, Glossary-5 sm, 3-13, 4-74, 4-78 source, Glossary-5 source language,view and modify, 4-5 source line, Glossary-5 source mode, 3-6, 3
bc, 4-38, 4-52 breakpoint count, 4-38, 4-52 db, 4-38, 4-52 delete breakpoint, 4-38, 4-52 sb, 4-38, 4-52 suspend breakpoint, 4-38, 4-52 Status viewing commands I, 4-34 Inquire, 4-34 $STDIN, 4-36 $STDOUT, 4-36 step, 3-9, 3-18, 4-35, 4-36 Step, 3-9, 3-18, 4-35, 4-37 stepping through a program, 3-18 stopping execution (temporarily), 3-20 string, Glossary-5 suspend assertion, 4-60, 4-63 suspend breakpoint, 4-38, 4-52 suspend datatrace, 4-64, 4-67 suspend more, 3-13, 4-74, 4-78 symbolic debugger use of, 3-1 T >@
Trace, 4-31, 4-33 trace paragraph, 3-22, 4-38, 4-58 tracing function and procedure calls, 3-27 ts, 3-17, 4-15 U V Index-14 u, 4-15 U, 4-15 undef, 4-71, 4-73 update, 4-15 Update, 4-15 uplevel breakpoint, 4-5 use of carriage return, 4-16 use of symbolic debugger, 3-1 user-de ned macro, 4-71 v, 3-12, 4-16, 4-19 V, 3-12, 4-16, 4-19 va, 4-16, 4-20 var, Glossary-5 variable, Glossary-5 variable name size, 4-3 view, 3-12, 4-16, 4-19 View, 3-12, 4-16, 4-19 view address, 4-16, 4-20 view debugger state I, 4-34 Inqu
next, 4-18 Next, 4-18 search backward, 4-16, 4-17 search forward, 4-16 v, 4-19 va, 4-20 view, 4-19 view address, 4-20 view stack, 4-31 view stack commands, 4-31 view stack, Figure 4-1, 4-31 VMS FORTRAN record support, C-1, C-3, C-3 VMS FORTRAN record types maps, C-3 records, C-3 structures, C-3 unions, C-3 W w, 3-14, 4-15 window, 3-14, 4-15, Glossary-5 window mode commands, 4-13{15 oating point registers, 4-13 fr, 4-13 general registers, 4-13, 4-14 gr, 4-13, 4-14 special registers, 4-13, 4-14 sr, 4-13, 4-1
X Index-16 x, 4-60, 4-63, 4-64, 4-67 xdb command, 3-4, 3-28 xdbend.lib.