
System Debug Reference Manual (32650-90888)

318 Chapter8
System Debug Windows
Q - The CM Stack Frame Window
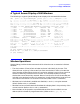
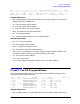
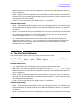
005210:N [2] FOPEN+%6 000600 .. ZERO, NOP
005211: [3] FOPEN+%7 051451 S) STOR Q+%51
005212:N FOPEN+%10 140060 .0 BR P+%60
005213: FOPEN+%11 140003 .. BR P+3
005214:N [1] ?FSOPEN 170412 .. LRA P-%12
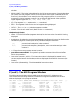
nmP$ TRANS 24.6b7bb8 (translated CM Seg SYS %22 XLSEG11) Level 0,0
006b7bb8:N @[1] ?FOPEN 340c1504 LDO 2690(0),12
006b7bbc: 34191510 LDO 2696(0),25
006b7bc0: 0c991264 STHS,MA 25,2(0,4)
006b7bc4: d19adff0 EXTRS,>= 12,31,16,26
006b7bc8: e680e792 BLE,N 968(7,20)
006b7bcc: e566204e BLE,N 53284(4,11)
006b7bd0:N [2] FOPEN+%6 0800024c OR 0,0,12
006b7bd4:N 646c00a4 STH 12,82(0,3)
006b7bd8:N FOPEN+%10 e8000232 B,N $006b7cf8
Commands
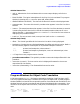
%31 (%44) cmdebug >
window banner line
• (T) - The CM segment is currently running in translated mode.
• TRANS 24.6b7bb8 - The NM program window is aimed at translated code. The original
CM segment is identified as SYS %22 XLSEG11.
window body line(s)
• Node points are denoted by N.
• breakpoints - Breakpoints are displayed between the offset and the procedure name.
Refer to the conventions pages for a description of all possible breakpoint notations.
@[1] global breakpoint, index number 1
[2] process local breakpoint, index number 2
• procedurename+offset - The NM program window shows where each node point is in
the original CM object code. The "?" indicates an entry point for CM procedure names.
Refer to chapter 2, section "Procedure Name Symbols" for details on the conventions
used for procedure names.
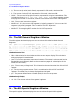
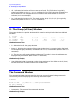
Q - The CM Stack Frame Window
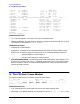
The frame window tracks Q, the most recent CM stack frame.
Q % (DB mode) QDST=000160 Level 0
000670: 000000 000000 000000 140026 000004 000000 000004 000000
000700: 000002 000132 000253 060301 Q>000010 000000 000000 000000
000710: 000002<S
window banner line
• Q % - Abbreviation for the window and the current output display radix.
• (DB mode) - The address mode for the window. This can be DB, DL, Q, S,orDST. The