
System Debug Reference Manual (32650-90888)

Chapter 2 21
User Interface
Command Line Overview
2 User Interface
The System Debug user interface is command oriented. That is, all requests for System
Debug to perform some operation must be expressed as commands. Normally, commands
are read either from the standard input device ($STDIN) in the case of DAT, or from the
session LDEV using low-level I/O routines in the case of Debug. But commands may also
be read from command files, sometimes known as use files, stored on disk.
System Debug output is displayed in one of two ways. List output is typically written to the
user's terminal as a sequence of lines, but may also be automatically echoed to disk files,
interleaved with the interactive command input that generated it. System Debug also
offers a tiled window facility, which provides an interpretation of the machine state as well
as code and data memory areas. The windows are updated to reflect changes in the
displayed areas that occurred between commands.
This chapter discusses the various data types supported by System Debug and how values
of these types are created or accessed, manipulated, and stored. Other topics, such as error
handling, Control-Y startup processing, error handling, Control-Y management, and
debugging at the console, are also discussed.
For detailed information of the syntax, operation, and output of individual commands,
please refer to chapters 4, 5, and 6. Windows, and the commands that control them, are
explained in chapters 8 and 9.
Command Line Overview
System Debug displays a prompt when it is ready to accept a command interactively. The
standard prompt looks like this:
$10 ($42) nmdebug >
The first number is the current command number. This is the number that is assigned to
the command entered at the prompt. Blank lines do not cause the command number to
increase. The number in parentheses is the process identification number (PIN) of the
current process. If Debug is entered from the CI, then this is the CI's PIN.
The dollar signs in front of the numbers indicate that the current output radix is
hexadecimal. Except for a few obvious exceptions, most numbers are displayed in the
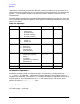
current output base. The abbreviations for numeric radices are
% - octal, # - decimal, $ - hexadecimal.
The nmdebug > part of the prompt is composed of two parts. The first, nm, indicates that
the current mode of System Debug is native mode. The other possibility is cm for
compatibility mode. The second part, debug, identifies the name of the tool being run.