
NS3000/iX Operations and Maintenance Reference Manual (36922-90039)


46 Chapter3
Getting Information About the Network
Displaying Network Performance Information
Displaying Network Performance
Information
You can display network performance information using a number of
the tools available through NETTOOL. LOOPINIT, RESOURCE MONITOR,
and XPPERF all provide performance monitoring features.
To Monitor Round Trip Response Time
The LOOPINIT tool allows you to send a series of packets to a specific
remote node and display the minimum, maximum, and average times
required for the packets to complete the round trip. Chapter 6, “Using
NETTOOL,” includes step-by-step instructions for running LOOPINIT.
To Monitor Resource Usage
The RESOURCE MONITOR tool allows you to display the current usage of
specified resources. This is useful in situations where you suspect
over-utilization of a resource.
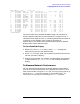
This tool provides two types of displays: the one-line (non-verbose)
display and the detailed (verbose) display. The one-line format lists
current use of resources, the maximum experienced (high-water mark),
and the maximum allowable usage for specified resources. See the
following example.
The verbose mode displays information about a particular item,
providing an interpretation of resource usage and pointing to possible
relationships with configurable parameters.
To Get a One-Line Display
Perform the following steps produce a resource display in non-verbose
mode.
1. Run NETTOOL by entering the program name at the MPE prompt:
NETTOOL.NET.SYS
The root menu will appear.
2. Select the RESOURCE MONITOR tool from the main menu by entering
the RESOURCE command. A new menu will appear.
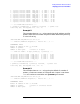
3. Enter DISPLAY to display resource usage. The tool will produce a
table similar to the following: