
Basic System Problem Analysis - August 2003
75
Case Study: Hang Memory Dump continued
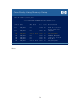
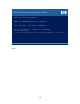
What we do once we find an interesting process is to switch to that pin and have a look at
the trace. That isn’t shown in the illustration on the prior page:
$14a ($0) nmdat > pin 35
$150 ($35) nmdat > tr,d,i
PC=a.0017099c enable_int+$2c
NM* 0) SP=41853ef0 RP=a.00786004
notify_dispatcher.block_current_process+$338
NM 1) SP=41853ef0 RP=a.00787e44 notify_dispatcher+$268
NM 2) SP=41853e70 RP=a.001b6034 sem_block.wait_for_resource+$1bc
NM 3) SP=41853d70 RP=a.001b6428 sem_block+$358
NM 4) SP=41853cb0 RP=a.00757ce8 cb_shr_lock+$240
NM 5) SP=41853bb0 RP=a.00757a94 ?cb_shr_lock+$8
export stub: fb.011380f8 lock'set'exclusive_345+$230
NM 6) SP=41853a70 RP=fb.0113bc78 nmdbunlock+$16f4
NM 7) SP=41853a30 RP=fb.0109ae70 dblock+$10c
NM 8) SP=418522b0 RP=fb.0109ad38 ?dblock+$8
export stub: 48f.000060a0
NM 9) SP=418521b0 RP=48f.00000000
(end of NM stack)
The call to “SEM_BLOCK” at level 3 (or 4 if we want to look at the parameters to it!) is
what causes the process to block on a semaphore owned by some other process.
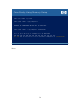
Illustrated is the use of the PM_SEMAPHORES macro which is actually an easier way of
extracting the address of the semaphore. That address can then be passed to the
RM_SEMAPHORE macro which will list the processes waiting on it as well as the
owner PIN and format it for you (not shown in the illustration).