
Basic System Problem Analysis - August 2003

73
Case Study: Hang Memory Dump
If you have a memory dump of a hang it is not so important to begin looking at stack
traces as it is finding “interesting processes”. These would be processes blocked in ways
that would not be normal.
Now, without having had the complete MPE/iX internals training and a few years of
reading memory dumps, knowing what is “normal” is not quite that simple. For example,
“JUNK_WAIT” doesn’t look all that normal but it is. Pin 2 is the CM loader process and
that is how it normally waits. Likewise, pin 1 is PROGEN and it waits on a “port”.
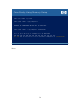
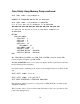
Illustrated on the previous page is output from the PROCESS_WAIT macro which
walks down the list of processes and reports what they are blocked on. This is probably
the best macro to employ when beginning to look at a memory dump of a hang. This
macro can be used in DEBUG as well, but when the system is running, even slowly you
would need to be skeptical of any output because process states could change.
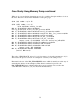
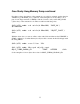
The “CNTRL_BLOCK_WAIT” is definitely an “interesting process” because this
indicates that the process has blocked on a semaphore.
The full listing from PROCESS_WAIT actually showed a large number of processes in
this state.