
Basic System Problem Analysis - August 2003


71
Before Memory Dump
Gather as much information as possible!
If you are able to log on or if a session logged on as MANAGER.SYS is already logged
on you should try to gather as much information as possible.
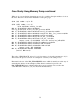
SHOWPROC is extremely useful in cases where the system is not completely hung up
but people are complaining of problems. For example,
SHOWPROC PIN=1;TREE;SYSTEM
Will display all processes on the system. Use this to locate processes that may be
blocked. You would see either “BLKMM” or “BLKCB” for processes blocked on
memory or on a control block.
If you find processes in this state repeat the SHOWPROC command on those specific
PIN’s to see if their CPU time increases. It is completely normal for processes to be
blocked in this way but if they remain blocked without accumulating CPU time then they
may be part of the problem. They would be a good place to begin looking.
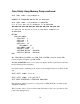
You can use DEBUG to trace their stacks too. A useful way to do this would be as
follows, say we find PIN 9a blocked on memory and it appears to be using CPU time but
anytime you catch it with SHOWPROC it is back in that BLKMM state:
$1a ($2d) nmdebug > pin 9a;tr,i,d
You will note that the pin command and the trace command are submitted together
separated by a semicolon. That minimizes the time between the two commands so you
area more likely to catch the process in a way that will allow a useful trace to be
displayed. Remember, the process is running, it may be slow, but it’s running!
You could also use the “CRON” (carriage return repeats the last command) feature, as in:
$1b ($2d) nmdebug > set cron
Then all you would need to do is press return to capture a trace.
If the process is using NO CPU time then you would still want to grab a stack trace
because you may find that the process is blocked on something which can be fixed
without the need of getting a memory dump!