
Kernel Debugging Guide
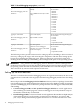
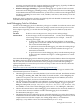
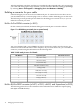

Table 1-1 Kernel debugging setup options (continued)
Works with the following HP Integrity
server models:
• BL860c
• BL870c
• BL860c i2
• BL870c i2
• BL890c i2
• rx2800 i2
• rx1620
• rx2600
• rx2620
• rx2660
• rx3600
• rx4640
• rx6600
Serial (RS232) null modem cable (DB9
female)
+
5x2-to-DB9M converter (for rx1620
only)
Laptop or workstation
+
Microsoft Debugging Tools for
Windows
Works with the following HP Integrity
server models:
• rx5670
• rx7620
• rx8620
• Superdome/sx1000
CAT-5 cable (RJ45)
+
RJ45-to-DB9F converter
Laptop or workstation
+
Microsoft Debugging Tools for
Windows
Works with the following HP Integrity
server models:
• rx7640
• rx8640
• Superdome/sx2000
No cable required.
(These servers are debugged
remotely, over a LAN, as described
in the next chapter.)
Laptop or workstation
+
Microsoft Debugging Tools for
Windows
The following sections provide instructions for setting up the host, building a cable converter if
necessary, setting up the target, and connecting the components with the cable. Setting up the
host involves installing the debugging tools. Setting up the target can involve locating and
enabling the kernel debug port and adding a boot configuration option to the operating system.
IMPORTANT: Using the Microsoft Debugging Tools for Windows software to debug kernel
problems is beyond the scope of this document. Debugging the kernel requires deep knowledge
of operating system internals and familiarity with the architecture of the HP Integrity servers.
This is best done by someone with expertise in both areas.
Setting up the host machine
The host is a machine that runs the debugging session. In a typical environment, the host is the
computer that is connected to the target (the machine being debugged) and that runs the debug
tools.
Microsoft provides the Debugging Tools for Windows software, which is a package of extensible
tools for debugging user-mode and kernel-model programs on the Windows family of operating
systems. The Debugging Tools for Windows package contains four debuggers: CDB, NTSD, KD,
and WinDbg.
• Console Debugger (CDB) and NT Symbolic Debugger (NTSD) are console applications
that can debug user-mode programs. These two debuggers are nearly identical except in
the manner in which they are launched.
• Kernel Debugger (KD) is a character-based console application that enables in-depth analysis
of kernel-mode activity on all operating systems based on Windows. You can use KD
(kd.exe) to debug kernel-mode programs and drivers or to monitor the behavior of the
12 Debugging the kernel locally