
Windows Integrity Kernel Debug Guide

systems. The Debugging Tools for Windows package contains four debuggers: CDB, NTSD, KD,
and WinDbg.
• Console Debugger (CDB) and NT Symbolic Debugger (NTSD) are console applications
that can debug user-mode programs. These two debuggers are nearly identical except in
the manner in which they are launched.
• Kernel Debugger (KD) is a character-based console application that enables in-depth analysis
of kernel-mode activity on all operating systems based on Windows NT. You can use KD (
kd.exe) to debug kernel-mode programs and drivers or to monitor the behavior of the OS
itself. KD also supports multiprocessor debugging. Typically, the KD tool runs on the host
but not on the computer being debugged.
• Windows Debugger (WinDbg) is a powerful debugging tool capable of both user-mode
and kernel-mode debugging. WinDbg (windbg.exe) provides full source-level debugging
for the Windows kernel, kernel-mode drivers, and system services and for user-mode
applications and drivers. WinDbg can view source code, variables, stack traces, and memory
and can set breakpoints.
Debugging Tools for Windows includes an online help file with detailed documentation on each
tool. See this help file for more information.
Install Debugging Tools for Windows
Versions of the Debugging Tools for Windows package are available for 32-bit x86, native Intel
Itanium, and native x64 platforms. Choose the package version based on the processor of the
host computer. Typically, you would select the Debugging Tools for Windows (x86) 32-bit
package.
x86 Host If the host uses an x86 processor, always use the 32-bit package.
Itanium Host If, like the target, the host is Itanium-based — an entry-level HP Integrity
server being used as a development platform, for example — then the
following rules apply:
• To analyze a dump file, use either the 32-bit package or the Itanium
package. It does not matter whether the dump file is a user-mode dump
file or a kernel-mode dump file.
• To perform live kernel-mode debugging, use either the 32-bit package
or the Itanium package. It does not matter that the target is an
Itanium-based machine.
• To perform live user-mode debugging, always use the Itanium package.
It does not matter whether the target is a 64-bit application or a 32-bit
application.
You can install the Debugging Tools for Windows package from the Windows Driver Development
Kit (DDK), Platform Software Development Kit (SDK), or the Customer Support Diagnostics
CD. You can also download the latest release of the package from the Web. The package is
updated frequently. To ensure that you have the most up-to-date tools for the task, obtain the
package from the Web site:
http://www.microsoft.com/whdc/devtools/debugging/default.mspx
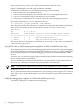
If you select Custom Install, you can control which features in this package are installed. The
Custom Install options are as follows:
• The Debuggers feature is selected by default. If you leave this selected, installation includes
the debuggers WinDbg, KD, CDB, and NTSD; associated modules, such as DbgHelp; the
symbol server SymSrv; the source server SrcSrv; the dump file tool ADPlus; the remote
debugging tool DbgSrv; and several extension libraries.
• The Tools feature and its Helpful Tools subfeature are selected by default. If you leave these
selected, installation includes the tools SymStore, SymChk, DbgRpc, Logger, LogViewer,
28 Debugging the kernel remotely