
PMP User Guide v5.5


Using the Performance Management Pack interface 9
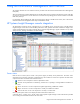
Server status applies only to servers currently being monitored. An Unknown icon for a specific server in the PF
column of the Systems Insight Manager console indicates that performance information is not available for that server.
Clicking the Unknown icon for a server displays detailed reasons why the information is not available.
An Unknown icon might appear for any of the following reasons:
• A server is not licensed.
• A server is licensed but not marked for monitoring.
• A server is marked for monitoring, and PMP is in the process of judging the status of the server while gathering
the requisite number of samples.
• PMP finds that a server has changed configuration and has not yet taken a fresh snapshot of the configuration
or is in the process of judging the status of the server while gathering the requisite number of samples.
A critical status (a red icon with an “X”) indicates a critical problem with communication between the performance
monitoring service and the monitored server. When PMP finds that the server is not reachable at a first attempt, it sets
the status to critical. If PMP monitors a server without problems, and then unsuccessfully attempts to reach the server
twice, the Critical icon appears. Click this icon to display the reason for the problem.
The server might be unreachable for the following reasons:
• The server is powered off.
• The network connection between the monitored server and the middle tier (analysis server) might not be open in
both directions.
• The monitored server might not meet the minimum requirements. For a complete list of supported monitored
servers, refer to HP ProLiant Essentials Performance Management Pack Support Matrix.
• One or more HP Management Server agents are not running on the server, and PMP cannot collect the
information required.
• HP Management agents have been downgraded.
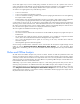
Server licensing and administration information can be accessed from the HP Systems Insight Manager console
toolbar by clicking Options>Performance Management Pack Options. For more information about
administration and licensing, refer to HP ProLiant Essentials Performance Management Pack Setup and Installation
Guide.
Online and Offline Analysis
The PMP Online and Offline Analysis tools provide an intuitive interface to detail the performance status and
inventory of monitored servers and the processors, memory, local and external storage, network storage, network
connections, host bus and virtual machine host components for each server. The tools provided for Online and Offline
Analysis are similar in overall functionality. The major difference in performing Offline Analysis is that the data comes
from a database rather than a real-time data stream.
Additionally, if you want to obtain performance analysis in a static setting, PMP provides many tools to assist in
monitoring server performance. For additional information about Offline Analysis, refer to Chapter 2 of this guide.
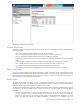
When a monitored server icon is selected from the PF column of the Systems Insight Manager console, or when you
select Diagnoze>Performance Management Pack>Online Analysis from the console toolbar, the PMP
Online Analysis screen appears in a new browser window, as illustrated in the following figure. The analysis starts in
the performance status view for the server.