
PMP User Guide v5.5


Appendix B 65
Appendix B
Sample system summary report
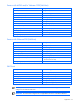
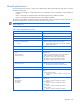
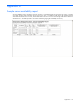
System Summary reports are created in a browser window in a printable format. The report has two sections. The first
section consists of a table showing what percentage of time each server subsystem was in a bottleneck state during
the selected interval. This table provides a convenient method for gauging the performance health of a server.
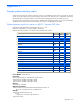
The second section of the summary report includes a detailed system configuration listing. This is the same information
available for each component in the Online Analysis. This section is not applicable to VM Guests.
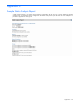
System summary report for a server or MSVS / Vmware GSX Host
Performance Management Pack Summary Report for 131.111.1.71
Hardware Configuration as on 03/16/2004 11:00:00 AM
Reporting from 03/16/2004 11:19:03 AM to 03/19/2004 12:41:04 PM
Subsystem
%
Normal
%
Minor
%
Major
Processors 96.0 4.0 0
Memory 68.0 14.0 18.0
Network Connections 100 0 0
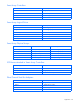
NC3131 Dual Port 10/100 Fast Ethernet Base
Adapter
100 0 0
Port ID: 1
100 0 0
NC3131 Dual Port 10/100 Fast Ethernet Base
Adapter
100 0 0
Storage 100 0 0
Smart Array 4250ES 100 0 0
Array: A 100 0 0
Internal Drive Cage 100 0 0
Storage Works Fibre Channel Host Bus Adapter/P 100 0 0
Host Buses 100 0 0
Primary Bus 100 0 0
Secondary Bus 100 0 0
Tertiary Bus 100 0 0
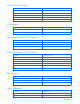
Server Model: ProLiant ML750
Processors
Intel® Pentium® III Xeon
TM
700 MHz with 2-MB L2 Cache
Pentium III Xeon 700 MHz with 2-MB L2 Cache
Pentium III Xeon 700 MHz with 2-MB L2 Cache
Pentium III Xeon 700 MHz with 2-MB L2 Cache
Memory
Total Memory: 4096 MB
Network Connections
NC3131 Dual Port 10/100 Fast Ethernet Base Adapter (PCI Slot #: 3)
(Port Id #: 1) Compaq NC3131 Fast Ethernet NIC
Storage
Smart Array 4250ES (PCI Slot #: 10)
Array A
Logical Drive 1 (Windows Physical Disk: 0)
Internal Drive Cage