
PMP User Guide v5.5

Appendix A 60
Appendix A
Sample CSV file
PMP enables you to generate many reports, and each user can have a different set of requirements. Therefore, PMP
supplies all of the performance information gathered in a file that can be read by many desktop-reporting tools,
including Microsoft Excel.
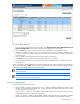
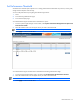
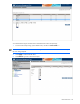
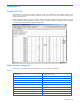
The following figure depicts a summary report generated in CSV file format and displayed in Microsoft Excel. This file
format contains fully annotated performance data in a table, enabling information to be displayed and manipulated
in a wide variety of data analysis and graphing applications.
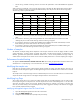
Measurement categories
The following is a list of the measurement categories for servers and subsystem components.
Servers
• Sample time • Page faults per second
• Server performance • Page reads per second
• Processor performance • Available Megabytes
• Average processor busy • NIC performance
• Processor busy • NIC Megabytes per second
• Interrupts per second • Storage performance
• Context switches per second • Storage transfers per second
• Memory performance • Storage Megabytes per second
• Hard page faults per second • PCI performance
• Pages input per second • Host bus Megabytes per second