
PMP User Guide v5.5

PMP maintenance 54
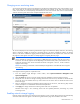
• Monitor & Log—Enables monitoring of servers and stores the performance in the PMP database for playback
later.
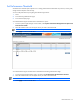
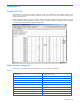
When monitoring is started for a server, the alert and log status in the table will reflect that the Alert and Log options
are chosen. When the monitoring is stopped, the table will always show the previous state of Alert and Log status.
The following scenario explains the details.
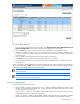
Check box options Results in the table Sl #
Monitor Alert Log Monitoring Alert Log
1
2
3
4
5
6
7
1. Row number 1: Monitoring is started, Alert and Log enabled. The results will be Started, Tick and Tick in the
table.
2. Row number 2: Monitoring, Alert and Log disabled. The results will be Blank, Tick and Tick in the table
reflecting the previous state of Alert and Log when the monitoring is stopped.
3. Row number 6: Monitoring is started, Alert enabled and Log disabled. The results will be Started, Tick and
Blank reflecting the current status whenever the monitoring is started.
4. Row number 7: Monitoring, Alert and Log disabled. The results will be Blank, Tick and Blank reflecting the
previous state of the Alert and Log when the monitoring is stopped.
Number of samples
The Number of Samples setting allows adjustment of the analysis of PMP to account for highly variable or stable
system performance. A higher number of samples used results in smaller average changes in performance and,
therefore, generates fewer performance bottleneck indications for a server whose performance changes wildly. A
smaller number of samples can be used for servers with more stable performance or when the sampling rate is higher.
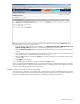
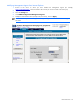
Performance threshold setting
The hyperlink To Set Performance Threshold values click here allows setting the performance threshold values for the
selected server in a separate page. For more information, see section “Set Performance Threshold
”.
Modifying the sample rate
PMP does not control the amount of time between samples. Instead, the sample rate (data collection interval) is set
from within the HP Management Agents. The Management Agents can be modified from the Control Panel or Internet
Explorer.
The sample rate for a network storage enclosure is determined by the servers to which the enclosure is connected. The
sample rate for the storage enclosure is the highest sample rate of the connected servers.
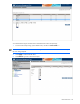
Modifying Log Days
The Log Days option allows you to choose the number of days that you need data logged for. You can select a value
for this option using the two drop down lists. The first drop down list contains values starting from 1 to 20. The other
drop down list contains options such as Day(s), Month(s) and Year(s). For example, if you select 2 in the first drop
down list, and select Year(s) in the second drop down list, data is logged for 760 days. The data that was logged
first is cyclically replaced as data is logged.
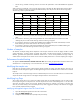
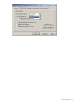
Modifying Management Agents from the Control Panel
1. Open HP Management Agents from within the Control Panel.
2. Select the SNMP Settings tab.
3. Modify the Data Collection Interval (sample rate) as necessary.