
PMP User Guide v5.5

Using PMP 38
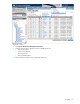
The following icons are provided for bottleneck navigation:
•
— Go back to the previous bottleneck
•
— Go forward to the next bottleneck
For example, if a status change happens at 6:00 A.M. from green to amber, yellow to amber, or green to yellow,
click the next or previous bottleneck navigation button and the Offline Analysis page for 6:00 A.M. appears.
However if status changes at 6:00 A.M. from amber to yellow, amber to green, or yellow to green, the next
bottleneck button will not navigate to that time.
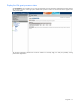
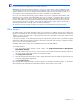
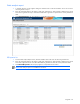
PMP Offline Analysis can detect hardware configuration changes. A message appears when a configuration change is
identified, as shown in the following figure.
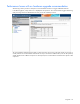
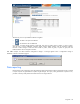
Data reporting
Because PMP can be configured to store all performance data measurements analyzed, stored data can be converted
to reports. Reports are generated from Systems Insight Manager. The report, when generated for a specific server,
provides a summary of the performance statistics for the time range selected.