
PMP User Guide v5.5

Using PMP 37
IMPORTANT: When Online Analysis is started for a server, an Online Analysis session is started automatically
for any licensed network storage enclosure connected to that server.
IMPORTANT: As PMP supports VMware ESX 2.5.2, 2.5.3, 2.5.4, 3.0, and 3.0.1, there are differences in the
way PMP analyzes servers running with VMware ESX operating systems. If you have VMware ESX operating
system installed and you have not configured Virtual Machines, PMP treats this ESX operating system as a
server similar to a Linux operating system. However, there is no difference in the data analysis.
TIP: If you have VMware ESX operating system installed, and you have configured Virtual Machines, PMP
treats this server as a VM host. When PMP identifies the server as a VM host, it is mandatory that it is licensed
through VMM. When the VM host is licensed through VMM, PMP collects performance data of the host.
However, PMP displays only limited performance data. PMP analyzes performance of the processor subsystem
and is presented to the server. In addition, in the Online and Offline Analysis pages, only the Inventory Tab is
present for the child nodes of 'Storage', 'NIC' and 'Host Bus' subsystems
TIP: Redirect icon for the VM Host will appear only when the associated VM Guests are being monitored.
Offline Analysis
The Offline Analysis tool enables performance data to be viewed from a database that has been captured and
logged over a specified time. This tool enables manipulation of the rate at which data is played back for analysis by
speeding or slowing the refresh rate or selecting specific points in the presentation of previously captured events
without regard to chronology.
In the previous example, it was determined that the system required more physical memory to handle the assigned
load balance. Offline Analysis enables examination and analysis of precisely what occurred on “pmpserver” between
3.01 to 3.37 P.M. when a problem occurred.
The Offline Analysis tool is used to view recorded data sessions from the PMP database.
To use Offline Analysis:
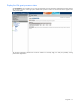
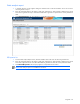
1. From the Systems Insight Manager console toolbar, click Diagnose>Performance Management
Pack>Offline Analysis.
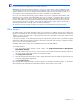
2. Select the checkbox next to the server or servers for which to view performance data. The checkbox at the top of
the column can be used to select all of the servers listed on the page.
3. Click Apply Selections>Run Now.
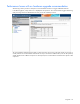
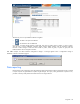
4. Select the start date and refresh rate for which to display performance data. The refresh rate determines the rate
at which the logged data is played back.
5. Click Start Offline Analysis.
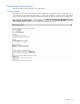
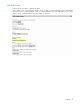
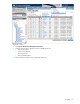
After selecting offline analysis parameters, the session appears as illustrated in the following figure. For information
about navigation tools and the tabs provided with this interface, refer to Chapter 1 of this guide.